
« New Orleans Pelicans Set Records Against the Timberwolves
Tyreke Evans and Small Sample Sizes
I’ve been known to get a little salty about how NBA fans, especially those of the Twitter variety, talk about and use statistics. I am by no means a statistics expert, but I’ve studied it enough to know that often what we refer to as “statistics”, as basketball fans, is just arithmetic. But that is a case of no harm no foul. Really, we are just being a bit conspicuous with our use of numbers, so we try and give it a more impressive name.
However, this point of the season always brings up a pet peeve of mine. Normally, I would do breathing exercises or count to ten, but I thought a more productive thing to do would be to write about it here for all of you intelligent and clever fans. If you follow me on Twitter, you’ve probably guessed I’m talking about the common usage of “small sample size” among NBA fans.
In short, I think all of people are using it incorrectly. When I see someone say something along the lines of, “Well, yeah but small sample size”. Often, what they are actually saying is we have seen a trend over a few games, and I don’t expect it to continue for much longer. Sometimes, that’s fine, but it can also be a blatant misuse of the concept. The other thing that bothers me is that it becomes a conditional statement. That is, people use it when it helps a point they are trying to make, but suddenly forget it when it damages their argument. Nope. When sample sizes are small, that is a statistical and mathematical reality that affects any estimation you want to make. There is no way around this. We can only say so much when we have fewer than 20-30 observations.
Obviously, we see these types of statement a lot in October and November, because every sample size is small. We’ve only played a handful of games. The truly relevant use of small sample size for statisticians is not inherently about something not meeting your expectations. It is a bit more nuanced. Let me explain by talking about Tyreke Evans (bet, you thought it was going to be another guard, right?).
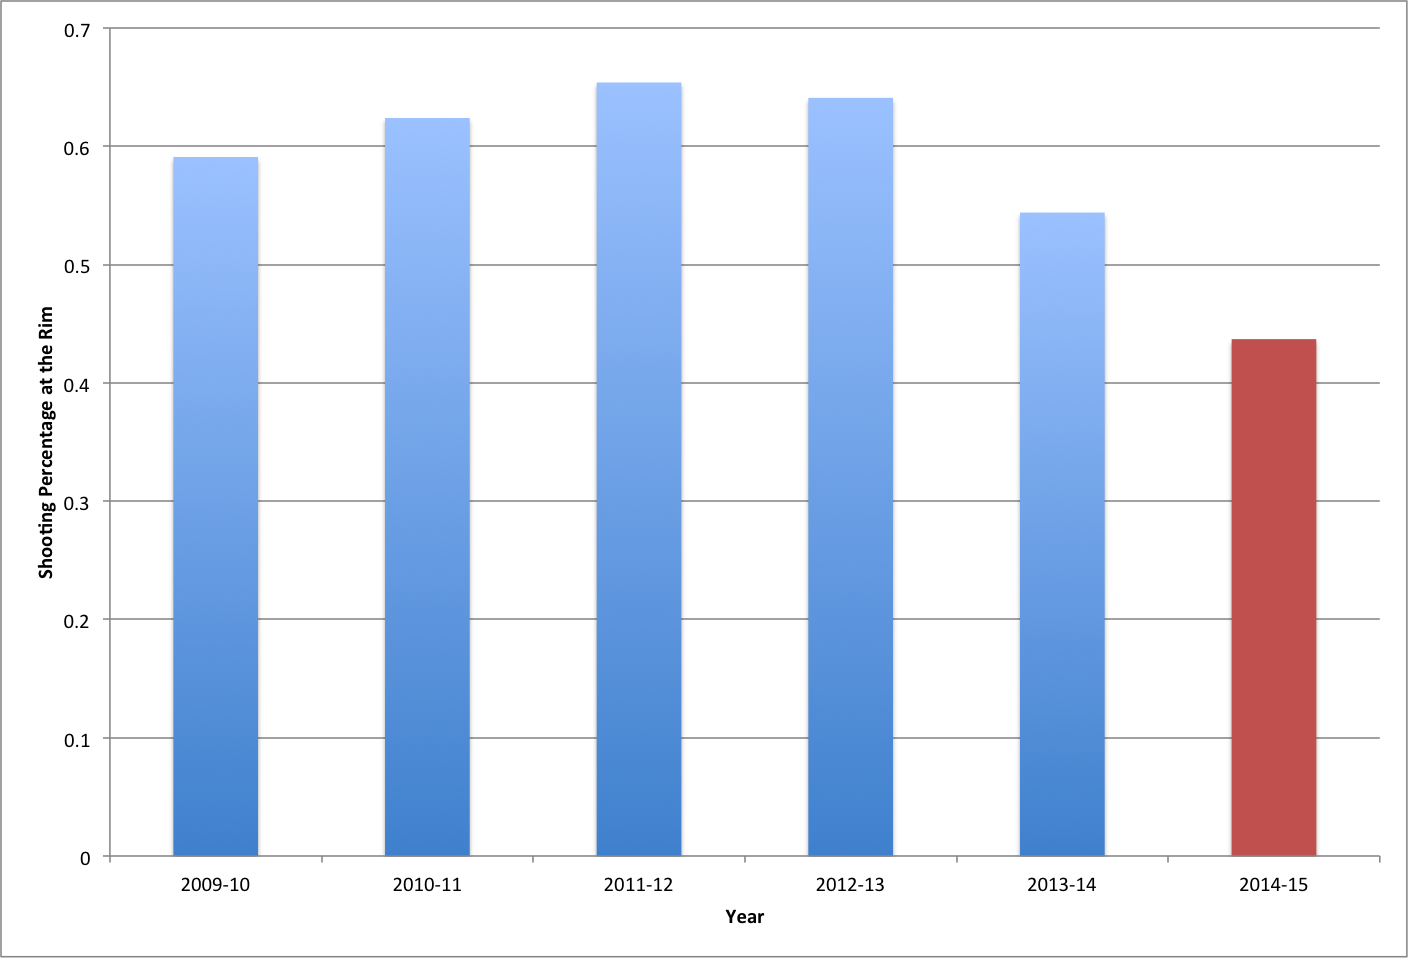
Here’s the thing. In eight games this season, Tyreke has been really bad at finishing at the rim. He is only shooting 43.7% within 3 feet. For his career, Tyreke has been a good to very good finisher with last year being his worst season when he finished at a rate of 54.4%. His best season was 2011-12 (65.4%). The chart below shows his shooting percentages at the rim over his career.
This is a pretty great case study of small samples. Basically, we have seen Tyreke shoot poorly at the rim. However, we haven’t seen a lot. Could this just be a fluke, or is something going wrong? Well, with that type of uncertainty, statistics sure can help.
First I want to know, how strange is what we’ve seen. In other words, given the number of shots he has taken this year, how likely is it that he would hit that many or fewer? We can use something called a binomial distribution to get an answer to this type of question. You can do some googling and find some clear explanations of what a binomial distribution is, so I won’t repeat them here. To give you a basic idea, a binomial distribution looks at cases where you either have a success or failure. Think about flipping a coin. It either comes up heads or tails. Then, it asks okay how many times did you flip it and how many times did you get heads? Once you give that it that information and the probability of a success vs. failure (50-50 for the coin example), it tells you here is the expected probability of you getting that many heads for the number of times you flipped.
Before I get to Tyreke I should say something about the assumptions of a binomial distribution. A binomial distribution assumes that each trial is independent. That is to say, a previous outcome will not affect future trials. In Tyreke’s case, missing or making a shot will not affect the probability the next shot goes in. This might be a little reductive. A player might have more confidence after making a shot, which may lead to a higher probability he makes another. Having said that, it seems reasonable to suggest that shots are closer to independent than dependent. That is why we see great shooters consistently shoot around the same percentage for a decade.
Anyway, for Tyreke, I said, he has shot 71 times at the rim this season (flips of a coin). He has made that shot 26 times (number of heads). Given his worst season rate at the rim, 54.4%, what is the probability that Tyreke would make 31 or fewer shots? In our coin example, I would have used 50% for a fair coin. However, I have to input a value for something like layups. I choose his worst season percentage to prevent any screams of bias. The result? The probability that Tyreke would make 31 or fewer layups on 71 attempts is .0451 or 4.51%. (Note: I’m using the cumulative density function, which adds all the probabilities from 0 to 31 shots. It didn’t make a significant difference either way, but I wanted to know what the odds were for him doing this well or worse.)
That’s low. Like really low. We would have expected, given his percentage during his worst season, that Tyreke would have hit at least a few more layups. Here is where we can say something about small sample sizes. Tyreke has taken 71 layups this year. Last season, he took over 500, which was the most he ever took in a season. The fewest layups he ever took in a season was 287 in 2010-2011, but he only appeared in 53 games. He usually plays about 66 games a year. In an average year, he takes a little fewer than 400 layups. So, if this year is typical than Tyreke has already taken somewhere between 14% and 19% of his total layups for the season.
Why does this matter? Return to our coin example. Let’s say I ask you to flip a coin with a 50-50 probability of heads or tails 10 times. You get heads 7 times. By pure intuition alone, if I asked you how crazy this result was, you’d probably say, “Meh, its more heads than I expected, but I’m not shocked.” Now, let’s do the same thing, but this time you flip it 1,000 times. If you got 700 heads, you’d be pretty shocked, right? In the first case, you thought that if you kept flipping you’d eventually get some tails in there. This is one of the problems with small samples. We don’t have enough data to make any conclusive statements about the population mean (i.e. what we are interested in measuring).
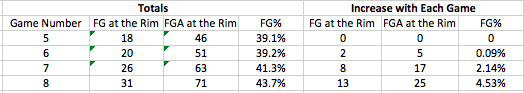
I want to talk about one more thing related to small sample sizes. I’ve been working with this data since about game 5 of the season. One thing, I’ve noticed is that the Tyreke’s shooting percentage has increased dramatically from then to now. He has increases from shooting 39% at the rim to about 43.7% at the rim, in only four games. The table below summarizes his totals and marginal increases from the San Antonio game until now.
What’s the point? Well, look at how adding just a few shots over a small number of games dramatically increased Tyreke’s overall layup percentage. When sample sizes are small, things like field goal percentage are very sensitive to adding another observation. Once our number of observations increases to a relatively large number, Tyreke taking and making that next layup won’t really affect his overall percentage. Right now we are so early in the season that a couple of good games can completely change your assessment. That is really the point here. When you draw a conclusion from a small sample size, you could be right or wrong. Tyreke may have a bad season shooting at the rim this year. That is entirely possible. The real point isn’t wether your assessment is right or wrong. The point is that small sample sizes impose some serious limitations, as we have seen from looking at these numbers. In short, the only real thing we can say, is that we can say much. Small sample sizes are just are hard and unavoidable truth of statistical inquiry.
I could leave it at that, but the social scientist in me won’t allow it. One of the major factors separating the social sciences from the natural sciences is the laboratory. In a lab, you take the one variable you’re interested in, and you say I want to measure this holding everything else constant. See why it would be hard for an economist, who is interested in measuring the affect of education on wage, to do that? He can’t just go around assigning a certain number of years of education to 1000’s of children at random. He doesn’t have a laboratory.
We also don’t have a basketball laboratory. There are a lot of factors going on at once. Some we can measure. Even more we can’t, and we certainly can’t hold every other factor constant. Still, when we see something like Tyreke’s poor layup percentage, it is fair to ask why. Why has he shot so poorly? Of course, we already talked about small sample sizes, but what was the cause? Often, it is injuries, but it can also be things like adjusting to a new system, changes to your play style or new teammates, or even the opponents you are playing.
I could go more in depth here and give my own opinions, but I’ve been going on for a while. Let’s just leave it at this. A relatively small number of observations make it difficult to draw conclusions in any direction. We haven’t seen enough games or lay up attempts to know if something is really wrong with Tyreke. His percentage could drop for any number of reasons, but we won’t know more until we approach that magical 20-30 game mark. Then we can say more, until now it is all conjecture in the small sample size theater.


10 Comments