Much has been made of Jrue Holiday’s turnovers in the first three New Orleans Pelicans preseason games. In fact, Ryan took note of them before they happened. For the purposes of this article, we take the 2013 preseason statistics to date and the idea that they predict regular season performance without quibble and examine Holiday’s performance with respect to turnovers.
Since we take the turnover stats at face value, we take them all as such. If small sample size can be ignored when causing worry, then it can be ignored when attempting to cure it. If the potential irrelevance is set aside for the purposes of causing worry, then it can be set aside when attempting to cure it. And so on.
Preseason Statistics
In about 78 minutes of play, Holiday had 17 turnovers: 8 against Houston (27 minutes), 4 against Dallas (24 minutes, I hate the Mavericks), and 5 against Orlando (27 minutes). The 8 turnovers against Houston really set the tone of the discussion, since the per 36 minutes rate was through the roof, and the rates against Dallas and Orlando, though better, are nowhere near what is considered acceptable. Last season, the worst per 36 minutes turnover rate by players with at least 1000 minutes logged was 3.7 (Will Bynum, Rajon Rondo, and Ricky Rubio). Jrue Holiday and James Harden were behind them at 3.6.
The above should give one pause. First, it is just unrealistic for turnover rates to remain that high according to the data from last season, which is nice to know. Second, Jrue, through among the highest-turnover-producing guards, is in good company: Rubio and Rondo are known as very good passers who are not skilled shooters.
So, what’s missing?
Taken alone, turnovers are not an effective measure of point guard prowess, as shown above. Turnovers can be a product of passing, and point guards are supposed to pass to other players to help them score. Said another way, the price of assists is turnovers. While turnovers can be generated by other means, looking at assist-to-turnover ratio gives a more complete picture of point guard skill. For example, last season there were 33 players who met the following criteria:
- Played at least 1000 minutes
- Averaged at least 24 minutes per game
- Averaged at least 5 assists per game
The criteria were chosen to make sure that the players were guards who distributed the ball. Of the 13 players with a TOV% below 8, only 4 are guards, showing that the people who turn the ball over the least are not really guards. The four guards all have single digit AST%, so even they are not really tasked with distributing. For reference, they are Willie Green, Marcus Thornton, Nick Young, and DeShawn Stevenson.
Chris Paul, Monte Ellis, and Stephan Curry all had 13.7 TOV% in that group. Paul’s AST%-to-TOV% ratio, however, was the highest in that group by a wide margin, 3.39:3.11, or almost 10% (relative) over Tony Parker. Stephan Curry was tenth at 2.27, and Monte Ellis was twenty-second with 1.98.
The switch to pace-independent statistics is done to better compare (not perfectly compare) players on different teams. The discussion was spurred by raw numbers, so per-time rates were quoted to better project the rates into regular season minutes.
A table with the players from that query, their AST%, their TOV%, and the ratio of those two statistics is included at the conclusion of the article for reference. Also, Derrick Rose does not appear, but his stats from 2011-2012 would place him ahead of Holiday.
So, we go back to the start but with a more complete analysis.
In about 78 minutes of play, Holiday had 18 assists and 17 turnovers coming the following pairings: 3-8 against Houston (27 minutes), 6-4 against Dallas (24 minutes, I hate the Mavericks), 9-5 against Orlando (27 minutes). Converting to AST% and TOV%:
| Game | AST% | TOV% | Ratio |
|---|---|---|---|
| 1 | 16 | 31 | 0.5 |
| 2 | 44 | 24 | 1.8 |
| 3 | 62 | 26 | 2.4 |
Looking at just the turnovers, one can see a reason to be concerned (again, assuming preseason stats predict regular season stats). Adding assists onto the canvas provides a clearer picture of the source of worry in the first game and the improvement since then, with the AST%-to-TOV% ratio hovering around the commonly-accepted-as-acceptable mark of 2:1. One can argue the sample size is not enough to show improvement, but there’s twice as much data showing improvement up to an acceptable level than there was to support the worry.
Past Passing Prowess
Maybe someone is worried that Holiday lacks the capacity to be a competent point guard, despite the All-Star selection. People have pointed to Derrick Rose being hurt as the likely cause of him being selected in an attempt to cheapen the achievement, as if Jrue Holiday did not beat out other guards in the Eastern Conference to be selected.
In Philadelphia:
| Season | AST% | TO% | Ratio |
|---|---|---|---|
| 2009-2010 | 24.4 | 21.9 | 1.11 |
| 2010-2011 | 29.0 | 16.7 | 1.74 |
| 2011-2012 | 21.6 | 13.2 | 1.64 |
| 2012-2013 | 36.5 | 17.3 | 2.11 |
Looking at the more effective measure, the one that distinguishes Chris Paul positively from Monte Ellis as a passer, Holiday had his best passing season in 2012-2013, despite the distracting rise in his TOV%. This can explained in part by some recent comments at Pelicans practice. When asked about how he was going to work through his current turnover issues (the supposed issue discussed in this article), he said the best way to work through it is to keep trying. This is consistent with the premise for the AST%/TOV% metric and his rise in TOV% coupled with his major rise in AST%.
Here is a plot of his AST%/TOV% for all 78 games last season:
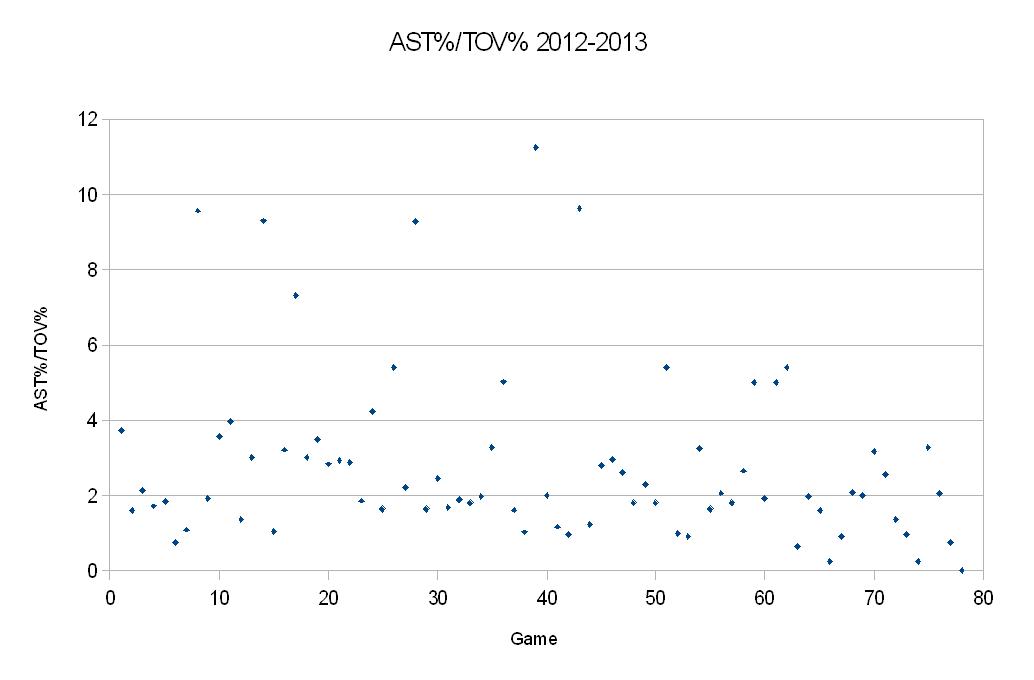
His passing effectiveness is basically unchanged through the season, with a few hints of drops in production near the end. In particular, his stellar passing games disappeared after midseason. Also, in the last 20% of the season, his very good games disappeared and 4 of his 5 worst passing games occurred. He performed worse in 3 of those games at the end than in the Houston outing. This tells me two things: the performance does not preclude a very good season as a passer, and it is possible that he formed a bad habit that he had to break / is breaking.
In any case, Holiday is a more than capable passer. In the list of 33 players noted above, Holiday is 17th, which is the median value: 16 players have better ratios (led by Chris Paul and Tony Parker), 16 have worse (Lin with the worst ratio, Hinrich and Collison slightly better). This is a short list of players, many of whom have weaknesses out side of their passing game that make them less desirable or strengths in other areas that make them harder to acquire. So, both in comparison to the 2:1 line-in-the sand and to the production of players with similar roles, Holiday fares well.
Summary
Holiday had a bad outing in his first game with a new team, and that rightly caused people to look closely at this performance, particularly in the area of turnovers. Turnovers alone do not tell the whole story of how effective or ineffective a passer is. Since a turnover is often the result of a pass attempt, or an interruption in a play where a pass to a scorer would have occurred, turnovers can be looked at as a cost that is paid as a part of being in the assist business. In business, a comparison of costs to benefits is the real measure of effectiveness, such as return on invested capital, so must assists be viewed with turnovers to get a complete picture.
Looking at Holiday’s passing numbers through three preseason games, his passing numbers through his career, and recent passing numbers of distributing guards, there is no reason to suspect that Holiday will put up significantly worse passing statistics than he has through his career. He has shown he can be quite effective, in fact. Additionally, Ryan showed that tidying up the pick and roll game will go a long way towards making reducing his turnovers while increasing his passing effectiveness, as opposed to just attempting fewer passes. This latter strategy would also be contrary to his solution: keep trying.
It would be nice for the TOV% to decrease and passing effectiveness to increase, as there is room for improvement. There’s just no need to panic at this time. There is more reason to believe that he will return not just to his mean performance, but to something better. How much better is somewhat up to Jrue, Monty, and luck.
| Player | AST% | TOV% | Ratio |
|---|---|---|---|
| Chris Paul | 46.5 | 13.7 | 3.39 |
| Tony Parker | 40.4 | 13.0 | 3.11 |
| Russell Westbrook | 38.4 | 13.2 | 2.91 |
| John Wall | 43.9 | 15.3 | 2.87 |
| Deron Williams | 37.5 | 14.5 | 2.59 |
| Jose Calderon | 39.8 | 15.8 | 2.52 |
| Kemba Walker | 31.2 | 12.4 | 2.52 |
| Greivis Vasquez | 44.9 | 18.6 | 2.41 |
| Kyrie Irving | 32.7 | 13.8 | 2.37 |
| Stephen Curry | 31.1 | 13.7 | 2.27 |
| Brandon Jennings | 29.1 | 12.9 | 2.26 |
| Kobe Bryant | 29.7 | 13.3 | 2.23 |
| Rajon Rondo | 49.3 | 22.6 | 2.18 |
| Ty Lawson | 30.2 | 14.1 | 2.14 |
| Goran Dragic | 35.7 | 16.8 | 2.13 |
| Jameer Nelson | 33.3 | 15.7 | 2.12 |
| Jrue Holiday | 36.5 | 17.3 | 2.11 |
| Jarrett Jack | 29.9 | 14.3 | 2.09 |
| Jeff Teague | 36.1 | 17.6 | 2.05 |
| Dwyane Wade | 26.6 | 13.2 | 2.02 |
| Damian Lillard | 28.8 | 14.5 | 1.99 |
| Monta Ellis | 27.1 | 13.7 | 1.98 |
| Kyle Lowry | 34.6 | 17.7 | 1.95 |
| Mike Conley | 29.5 | 15.1 | 1.95 |
| Raymond Felton | 27.0 | 14.2 | 1.90 |
| Mo Williams | 33.2 | 18.0 | 1.84 |
| Ricky Rubio | 38.8 | 21.4 | 1.81 |
| James Harden | 25.7 | 14.9 | 1.72 |
| Steve Nash | 32.8 | 19.3 | 1.70 |
| Andre Miller | 32.2 | 19.3 | 1.67 |
| Darren Collison | 26.8 | 17.0 | 1.58 |
| Kirk Hinrich | 27.5 | 17.5 | 1.57 |
| Jeremy Lin | 29.4 | 18.8 | 1.56 |
10 responses to “Overturning Jrue Holiday’s Turnover “Issue””
Nice.
Great analysis Jason. A turn over is the cost of doing business in the Assist game.
Now before this comparison moves to a comparison of why we let go of Vasquez who is #8 on that list, you may need to create a AST% to TOV% to defensive prowess statistic!
It is mathematically incorrect to use arithmetic operation on percentages. You must use rawnumbers. Math 101
hotshot I can think of cases where that is the case. For instance, I flip a coin 100 times and get 50 heads, so 50% heads. Then, I flip a coin once and get one head, so 100%. If I say: Hey, on average this coin comes up heads 75% of the time” then that is false. Using the raw numbers gives you 51/101, or about 50% again (just under 51% here), which is correct.
The above, however, is not doing that. What is being done is simply looking at numbers and noticing which one is biggest and taking ratios of different percentages to generate a rate.
Taking ratios of things to compare percentages is just fine, as is adding and subtracting in the right circumstances. You concern is appreciated, but a read of the article will show you the analysis is correct.
This is not my opinion. It’s straight from a math book. Percentages are a rank order. You can’t do arithmatic on a rank order metric. Please consult a math text, thats where I read it. You can only use mathematical operations on equal interval scales and ratio scales.Thus, A person who is six feet tall and stands next to Michael Jordan and Kareem Abdul Jabbar. He woud be in the 33%tile,Kareem would be in the 100%. and Michael Jordan would be in the 67%. If he stands next to two people who are 5 feet and five feet five . He is in the 100% tile. So if you add that persons percentile’s together and divide by two you would get his average percentile,which is approx. 67%. Since Michael Jordan falls at the 67% and he is 6 foot 7 you would conclude that the six foot man is as tall as Michael Jordan who is six foot seven. If you would use their actual height you would come out with the persons correct height, because height is a ratio scale.
Jason Calmes hotshot
A ratio is division and should not be used with percentages. That’s my understanding of the situation.
Ah. You are thinking of percentile. Those are ranks and care must be taken with them.
Percentages that are merely rescaled probabilities or approximations thereof are another matter entirely.
I can say that Holiday turns the ball over half as much as he assists or whatever. I can’t say he twice as good or half as bad as another player on that list I ordered by ratio.
Good thing I did not do that.
Let me know if you want to go over specifics in the article.
Jason Calmes
Thanks for the reply. I enjoyed the article.
No problem. Thanks for digging in rather than just skimming.
I was thinking that maybe the idea of AST% was unfamilar or my listing thoae guys in order at the end caused the confusion. You can just email that “changes” address if you wanted to talk specifics.
If you’re good to go, check out our other articles.