I am about to introduce a ground-breaking concept, so prepare to be amazed. In the game of basketball, there are only three ways (excluding the clock expiring at the end of a quarter) that a possession can end: a made shot, a missed shot + defensive rebound, or a turnover. The defense’s objective, therefore, is to force one of the latter two options. Wild, right?!
To date, the Pelicans have forced their opponents into turning the ball over on 16% of their possessions, which ranks in the top third of all NBA defenses. However, their overall defensive rating of 105.4 points allowed per 100 possessions is 6th worst in the NBA. The resulting conclusion, then, is simple – when the Pelicans are not forcing turnovers, they are giving up a lot of made shots. Why have they been so bad at shot defense? Let’s take a look.
Shot Locations
So where are these shots coming from? With the season about a third of the way complete, we’re at a point where hot streaks and cold spells will largely have had enough time to level off, which means that there is a high likelihood that opponents haven’t just been getting lucky with ill-advised attempts. The numbers appear to support this hypothesis as well: the Pelicans force their opponents into shooting only 38.3 percent of all shot attempts between the rim and the 3-point line, fourth lowest in the NBA. For comparison’s sake, the Bulls and Pacers lead the league by forcing about 49% of their opponents’ shot attempts from this distance. To make matters worse, New Orleans’ opponents are making about 40.5% of those shots, which is 6th highest in the NBA. That number can be somewhat fluky, however, so the #1 goal should be forcing more shots from this area regardless of previous teams’ success rates.
Now that we know where the shots are NOT coming from, we can easily infer where they are coming from – either right at the rim or from 3-point range. New Orleans allows 27.4% of their opponents’ total field goal attempts from 3-point range, 8th highest in the NBA. While that’s not great, they defend the 3-point shots they do give up at about the league average rate, so the team’s three point defense is a little below average but likely isn’t as much of an issue as previously thought.
Finally, we come to New Orleans’ defense on shots taken at the rim. The Pelicans allow 34.3% of opponents’ total field goal attempts from the restricted area, 8th highest in the NBA. Unlike the team’s mediocre 3-point defense, however, they compound this issue with poor interior defense on these shots, allowing opponents to make them at a rate of 61.5% (22nd in the NBA).
Additional Scoring Opportunities
The Pelicans allow the 7th worst effective field goal percentage (FG% weighted for the added value of a 3-pointer) of 51.4%. Despite everything detailed above, that ranking doesn’t appear to be bad enough to result in the league’s 6th worst defense given how good the team is at forcing turnovers. So what gives? As it turns out, there are two additional factors which are dragging the Pelicans’ defense down even further.
First, by allowing opponents to shoot the ball right at the rim so frequently, they are also much more prone to fouling and subsequent free throw attempts. Sure enough, New Orleans is tied with Miami for the 3rd worst free throw rate allowed to opponents, as they attempt .313 free throws per field goal attempt. The end result of this statistic is easy to see, as the Pelicans allow just over 25 free throw attempts per 48 minutes, 8th worst in the NBA. That’s almost 7 more free throw attempts allowed per game than the division rival Spurs, whose 18.5 free throw attempts allowed per game rank 2nd best in the NBA. Given the league average free throw percentage of right around 75%, that’s about 5 more points per game New Orleans is allowing from the free throw line than San Antonio. Add those 5 points per 48 minutes to the Pelicans’ average scoring margin, and they’d be sitting right in between the Clippers and Rockets at 7th best in the NBA. While that example is certainly a stretch, it gives some perspective in regards to how important it is to both attempt shots at the rim and prevent opponents from doing the same.
The second problem comes via the glass. Even if you’re able to force missed shots, it means relatively little if opponents grab the ensuing rebounds and give themselves extra scoring opportunities. Sure enough, the Pelicans allow an opponents’ offensive rebound rate of 27%, the 6th worst percentage in the league and a ranking which makes them the only team to fall in the league’s bottom 7 in both opponents’ eFG% and opponents’ ORR%. So, to put it simply, the Pelicans are giving up a high percentage of made shots and a lot of extra scoring opportunities after missed shots. Not exactly a recipe for success.
Conclusion
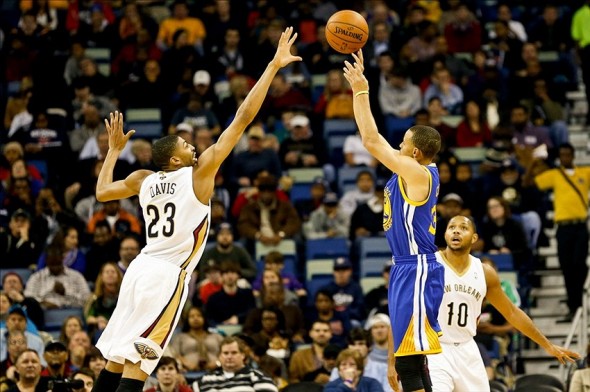
Plain and simple, the Pelicans need to take back the paint on defense. Given the fact that the team has Anthony Davis, this shouldn’t be as big of a problem as it is, but he ends up outside of the paint far too frequently. If the team won’t commit to playing him at center, then he’s going to end up chasing some players away from the rim or getting tied up in pick and rolls. The result, as Zach Lowe alluded to in his recent Grantland column, is no interior defense left to either protect the rim or come down with defensive rebounds. When Anthony Davis and Ryan Anderson play together, Davis HAS to be played as a true center and last line of defense between the ball and the hoop (see: Hibbert, Roy). Otherwise, this team will continue to get dominated for position inside and give up tons of points down low until it can find a legitimate defensive center who doesn’t commit fouls every 30 seconds and is competent enough on the offensive end to be played regularly. This Pelicans team can’t become the Pacers overnight, but they really should not be as bad on defense as they have been so far. With a greater commitment to protecting the rim, we could start to see some real improvements on the defensive side of the ball.
All raw statistical data obtained from the NBA’s media stats tool (and subsequently manipulated in this spreadsheet).
14 responses to “The New Orleans Pelicans’ Biggest Problem”
Tyson Chandler looked like a miserable human being playing for the Knicks yesterday in Madison Square Garden. He and all of the other Knicks players have to be looking for ways to bail on that rudderless team. Chandler would be a great solution to the Pelican’s defensive woes. Perhaps Dell Demps can put together some type of multi-team trade that somehow dumps Eric Gordon’s contract and brings Tyson back to New Orleans.
When watching, it sure seems like the Pels are either getting a turnover (and running an ugly fast break), allowing an open FG, or allowing an open miss. Your article supports this with numbers. Thanks.
Seems to me that almost everything MG says about our ultimate weakness at the rim and offensive rebounds has to do with Anderson at the 4 (a weak 4-5 combo); none of this would be true with AD at 4 with a real 5 (like a non-fouling Ajinca).
Thanks for good analysis. I thought our problem is defense but did not realize it comes down to our center play. I guess Demps realizes this since he brought in a big center, Ajinca. Hopefully he’ll help and maybe Stiemsma when he gets back.
I still wonder about a 3 team trade where we give Gordon, and get Asik and possibly Garcia. Houston can say they will “only trade with the (L)Eastern Conference” all they want, but the (L)East basically offers garbage players and/or draft picks. These assets won’t help Houston win now. So Houston didn’t take them and failed to meet their own Asik trade deadline. (Big surprise!) Either the (L)East gets better players ASAP, not likely, or Houston ends up considering trade options with Western teams and takes one. Why not one with Gordon?
I am not saying Asik is my favorite defensive center, but he is the best defensive center I know will get traded this season. And his value is low given that he has to go and he gets $15M next season before becoming a Free Agent. Maybe Asik’s value is low enough to fit in a trade with Gordon?
Houston wouldn’t trade for Gordon. It would be way too much money at 1 position for them. Houston has no problem scoring points and these articles indicate that it’s really the only thing he does well.
bradlaborde I think that was the purpose of suggesting a 3 team trade. Asik would go to New Orleans, Gordon would go to team X, and team X would send something to Houston.
Excellent article. The bottom line is A.D. is the CENTER FOR THIS TEAM!!! If Kareem at 7-2 225 lbs. , then A.D. 6-10 225. can do the job. A.D. is getting stronger and stronger. Kareem came in the league at 22 yrs. old. A.D is 20 yrs. old!!! He is the best rim protector in the league based on block shot average per-game. How about Granger and Ian Mahinmi for Gordon ? Gordon 14.2 mil and Granger 14.0 mil. evens out. The difference is Granger is 30 and Gordon is 25. Ian is at 4 mil. We would free up Evans back to his guard position. Smith impersonating a center is not good for the Pelicans or for him personally. Is it safe to say the Pelicans are up on these stats? The A.D. move is a MUST!!
Nice article.
You and Lowe are both absolutely correct. The rotations have been better, but nearly everyone on the team falls asleep on defense and makes dumb errors every night. Part of that is youth. Part of it is that Monty’s scheme needs to be tweaked given the players on the roster.
The hard hedge on pick and rolls needs to be shelved for a bit. Anderson, Smith, Anjica don’t have the quickness or the smarts to do this. Even Davis makes terrible mistakes hedging 25 feet from the hoop. I’ve seen more sagging from bigs the last month than I have in a long time. Hopefully that continues.
Another thing is that Aminu needs to play more. His rebounding is vital to the weak frontcourt. Aminu and Anderson should play together as much as possible. Their skills complement each other nicely. They have a solid +5.6 in Net Rating together. +7 when it’s Aminu, Anderson, and Davis. To McNamara’s article, 3 Man lineups with Aminu and Anderson are positive with every legitimate player except Gordon.
#freealfarouq
kfte I disagree. AD is a power forward right now, and probaly should be long term, like Tim Duncan. We need to start a center who plays well near the basket, and stop so frequently sending our center to the 3-point line to hedge on defense, or to pop 17-foot jumpers on offense. Let the other 4 players handle perimeter offense and defense most of the time, and let Davis go back to help defense down low. Right now his blocks are dropping off because there is rarely a true post defender to help.
We have Withey and Ajinca that might be able to help protect the rim, although the early returns on Ajinca’s foul rate are not good. We just don’t know about Withey yet. Let’s find out!
thouse
Agree on two huge points.
First, we don’t have a rim protecting center since AD guards opponents PFs often. So we can’t jump out on pick and rolls so much or so hard until that changes. (This is really where we miss Lopez and possibly why we need Asik.)
Two, Aminu and Anderson are almost the perfect compliments and PF and SF. No only do we need Aminu, we need to resign him at around his current salary. For a durable guy who will play around 24 minutes/game, whether as a starter or off of the bench, and do what Aminu does, that is a reasonable salary.
Davis will always be power forward not a center.One he’s undersize to play center,two he doesn’t have the physcally to play the postion and three he better against the best forwards.Even though the Pels have frenchmen this needs a Hibbert or Howard at center.
My assessment based on watching the games without using a calculator or consulting a spreadsheet is that the Pels have almost all the bodies they need to be better than average on D. (No knock on the advance stats guys. Just having a little fun.)
The Pels have a lot of long quick guys, a big PG that can really guard the ball and a couple of wing players (gordon and rivers) who can also be better than average on ball defenders. Yes, an Omer “Bill Russell” Asik defensive 5 would be great, but I think the guys we have in Smith, Ajinka, Withey, Steimsma, etc. could be adequate for a good defensive team. (The kind that has a top 5 offense and wins 50 games.)
The problem is that individually and collectively, our players play with a very low defensive IQ. Too many double teams of guys who don’t need to be double teamed (or at least not at the place on court where our guys are double teaming.) Too many guards fighting over picks against guards who cant shoot. Too many eyes losing track of the ball and their man. Defense is a lot about predicting what is going to happen and smartly positioning yourself before it happens. NBA players are too good to think you can just react to them and keep them from getting their shot. (Have seen some improvement since they stopped hedging every pick and roll play.)
Right now, our guys are defensive morons. They are trying hard, but that isn’t enough. You need some guile and right now they have none. Is that because the coach stinks? Or is it because the guys are young and need some time to get it together as a group? Or are some of our guys just too slow mentally to ever be good defenders? That is what I am trying to figure out this season.
I do not think that trading Anderson – who is a special player that can really cause opponents problems — for a good defensive center that cant catch the ball on offense is the answer. I think that is short term overreaction. Plus you make Houston almost unbeatable.
I see more promise in Ajinca than most. He will adjust to the way the game is called. I like his size and the way he is moving his feet on defense and getting in position where he is ready to come over and help. He’s shown a higher defensive IQ than J. Smith or Davis in that regard.
504ever Monty has to start putting Davis on centers. I get that Davis still needs protection (from injuries and foul trouble) but the defense will not work if he can’t be in the paint to control it. Will be interesting to see how they defend Howard tonight. I don’t think they can win if Davis isn’t on him most of the time.
And Aminu probably needs more minutes than 24 per game- he really should be playing as a bench 4 versus small ball teams. Box Score Geeks has numbers that I don’t totally buy, but they absolutely love him- like rating among the elite of the league.
Like I said, I don’t buy that but those guys are very smart so I do think Aminu is more valuable than most of the fan base believes. Aminu definitely needs to come back on a 3 or 4 year deal. I wouldn’t be upset with $4 or $5 million per year either.