« How L.A. Helped LA
Did Derrick Rose really have an “MVP Season”?
By now, most know that Derrick Rose became the youngest player in NBA history to win the MVP. But lately I’ve pondered whether his season was really MVP worthy compared to some past seasons that didn’t reap MVP trophies.
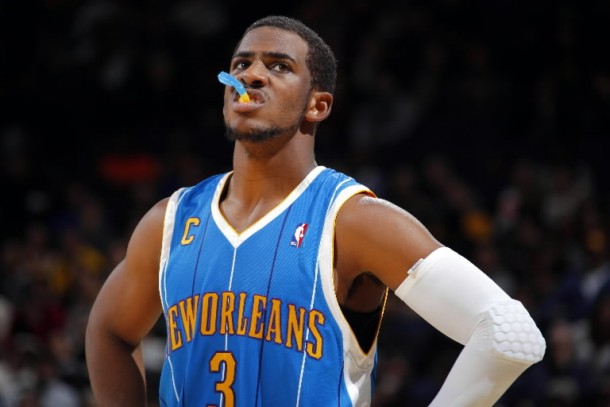
So, like any Hornets fan, I will use Chris Paul’s 08-09 season as the measuring stick for this post.
(Note: This journal is a little stat-heavy, so be prepared. And I realize that one must also consider the talent around a player when speaking of an MVP, not just their individual stats.)
Also, all stats for the Hornets are from the 2008-2009 season.
First, I’ll begin with scoring:
Rose: PTS 25.0
Paul: PTS 22.8
Naturally one would like to label Rose as the better scorer, but a look into the shot attempts shows that Derrick Rose attempts 3.6 more shots than Chris Paul did in 08-09. Of Paul’s 16.1 shots, 2.3 attempts were 3 pointers. So if he attempted 19.7 shots per game, he would attempt 2.8(.5 more) 3’s per game. This results in 1 made 3 pointer per game. The remaining 2 pointers(8.5) add up to 17 points. Add the 3 pointer and you’ve got 20 points without any free throws accounted for.
CP3 attempted .416 free throws per shot attempted, so if he attempted 19.7 shots he would take 8.19 free throws per game. Assuming he hit at his usual average of .868, he would make 7.11 free throws per game. Added with his 20 points from field goals alone, you have 27 points per game.
Advantage: Paul
Rebounding:
Rose: REB 4.1
Paul: REB 5.6
Paul has a clear cut advantage here. Playing 1.1 more minutes per game than Rose doesn’t impact the stat enough to consider.
Advantage: Paul
This next one is little more complicated, because assists may sometimes be inflated, depending on the talent around the player.
Assists:
Rose: AST 7.7
Paul: AST 11.0
To start out, I figured Derrick Rose would have averaged 7.9 assists had he played as many minutes as Chris Paul.
Hornets FG% (minus Chris Paul’s % because he can’t make an assist to himself): .441
Bulls FG%(minus Rose’s %): .461
Hornets 3FG%: .358
Bulls 3FG%: .367
(Thanks to hoopstats.com for these percentages)
The Bulls actually hit a higher percent of their 2 pointers and 3 pointers than the Hornets did.
The Hornets assisted on 58% of their jump shots while the Bulls assisted on 60% of their jump shots.
(Thanks to 82Games for this tid bit)
So this tells us that the two teams generally spot-up jump shot about the same amount, with the Bulls spotting up slightly more. Also, the Bulls hit higher percentages of these shots.
Advantage: Paul
Turnovers:
Rose: TO 3.4
Paul: TO 3.0
Rose would have averaged 3.5 turnovers had he played 38.5 minutes, like Chris Paul. Paul has and obvious advantage.
Advantage: Paul
Steals, Blocks:
Rose:
BLK 0.6
STL 1.0
Paul:
BLK 0.1
STL 2.8
Derrick Rose has the advantage as far as blocks go, but you are free to take .5 more blocks per game by a point guard as you please. But Rose doesn’t even compare to Paul in terms of steals.
Advantage: Paul
So, statistically, Chris Paul’s 08-09 season was better that Derrick Rose’s 10-11 season. However, Rose won 12 more games. This could be largely due to the better team around him, as demonstrated by the field goal percentages. This tells me that CP3 should have been the MVP in 2008, when he produced a very similar season. Also, this tells me that if Paul has more seasons like the one above, he should be at the top of the MVP race.


13 Comments