Every year, ESPN runs a segment called “NBA Rank,” where they rank the top 500 players in the NBA. They are in the midst of this process right now, and before the final results are divulged, I thought it might be a good time to take a peek at last year’s results and see if there are any patterns that emerged.
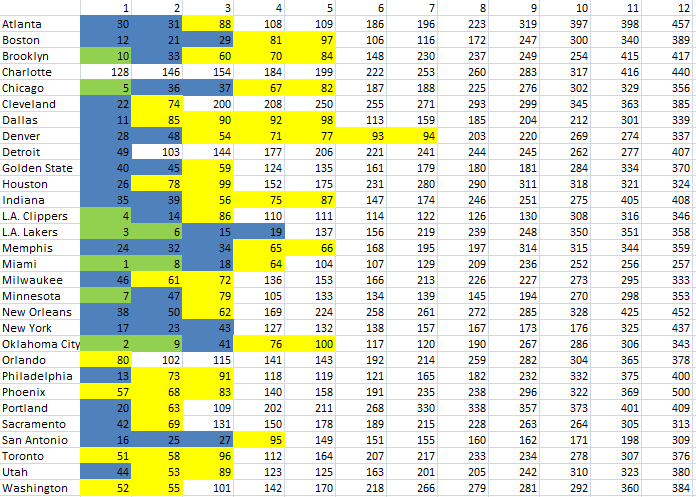
In 2012, 104 voters from various media outlets ranked each player on a scale of 1 to 10, and the players were assorted based on their average score. I compiled the data from each team into a painfully big spreadsheet and listed the top 12 ranked players on each team (besides Phoenix, who only had 11 listed players).
There were trades that happened at various times during the season, but in the interest of time and my sanity, I decided not to obsess over changing the information. I did alter Houston and Oklahoma City’s numbers by switching James Harden, Jeremy Lamb, and Kevin Martin to their proper teams (the ones they played with during the season).
The table reads fairly easily. Atlanta’s top-ranked player from 2012 was Al Horford, who was ranked 30th. Their next highest, Josh Smith, was 31st. Etc, etc.
| 1 | 2 | 3 | 4 | 5 | 6 | 7 | 8 | 9 | 10 | 11 | 12 | |
|---|---|---|---|---|---|---|---|---|---|---|---|---|
| Atlanta | 30 | 31 | 88 | 108 | 109 | 186 | 196 | 223 | 319 | 397 | 398 | 457 |
| Boston | 12 | 21 | 29 | 81 | 97 | 106 | 116 | 172 | 247 | 300 | 340 | 389 |
| Brooklyn | 10 | 33 | 60 | 70 | 84 | 148 | 230 | 237 | 249 | 254 | 415 | 417 |
| Charlotte | 128 | 146 | 154 | 184 | 199 | 222 | 253 | 260 | 283 | 317 | 416 | 440 |
| Chicago | 5 | 36 | 37 | 67 | 82 | 187 | 188 | 225 | 276 | 302 | 329 | 356 |
| Cleveland | 22 | 74 | 200 | 208 | 250 | 255 | 271 | 293 | 299 | 345 | 363 | 385 |
| Dallas | 11 | 85 | 90 | 92 | 98 | 113 | 159 | 185 | 204 | 212 | 301 | 339 |
| Denver | 28 | 48 | 54 | 71 | 77 | 93 | 94 | 203 | 220 | 269 | 274 | 337 |
| Detroit | 49 | 103 | 144 | 177 | 206 | 221 | 241 | 244 | 245 | 262 | 277 | 407 |
| Golden State | 40 | 45 | 59 | 124 | 135 | 161 | 179 | 180 | 181 | 284 | 334 | 370 |
| Houston | 26 | 78 | 99 | 152 | 175 | 231 | 280 | 290 | 311 | 318 | 321 | 324 |
| Indiana | 35 | 39 | 56 | 75 | 87 | 147 | 174 | 246 | 251 | 275 | 405 | 408 |
| L.A. Clippers | 4 | 14 | 86 | 110 | 111 | 114 | 122 | 126 | 130 | 308 | 316 | 346 |
| L.A. Lakers | 3 | 6 | 15 | 19 | 137 | 156 | 219 | 239 | 248 | 350 | 351 | 358 |
| Memphis | 24 | 32 | 34 | 65 | 66 | 168 | 195 | 197 | 314 | 315 | 344 | 359 |
| Miami | 1 | 8 | 18 | 64 | 104 | 107 | 129 | 209 | 236 | 252 | 256 | 257 |
| Milwaukee | 46 | 61 | 72 | 136 | 153 | 166 | 213 | 226 | 227 | 273 | 295 | 333 |
| Minnesota | 7 | 47 | 79 | 105 | 133 | 134 | 139 | 145 | 194 | 270 | 298 | 353 |
| New Orleans | 38 | 50 | 62 | 169 | 224 | 258 | 261 | 272 | 285 | 328 | 425 | 452 |
| New York | 17 | 23 | 43 | 127 | 132 | 138 | 157 | 167 | 173 | 176 | 325 | 437 |
| Oklahoma City | 2 | 9 | 41 | 76 | 100 | 117 | 120 | 190 | 267 | 286 | 306 | 343 |
| Orlando | 80 | 102 | 115 | 141 | 143 | 192 | 214 | 259 | 282 | 304 | 365 | 378 |
| Philadelphia | 13 | 73 | 91 | 118 | 119 | 121 | 165 | 182 | 232 | 332 | 375 | 400 |
| Phoenix | 57 | 68 | 83 | 140 | 158 | 191 | 235 | 238 | 296 | 322 | 369 | |
| Portland | 20 | 63 | 109 | 202 | 211 | 268 | 330 | 338 | 357 | 373 | 401 | 409 |
| Sacramento | 42 | 69 | 131 | 150 | 178 | 189 | 215 | 228 | 263 | 264 | 305 | 313 |
| San Antonio | 16 | 25 | 27 | 95 | 149 | 151 | 155 | 160 | 162 | 171 | 198 | 309 |
| Toronto | 51 | 58 | 96 | 112 | 164 | 207 | 217 | 233 | 234 | 278 | 307 | 376 |
| Utah | 44 | 53 | 89 | 123 | 125 | 163 | 201 | 205 | 242 | 310 | 323 | 380 |
| Washington | 52 | 55 | 101 | 142 | 170 | 218 | 266 | 279 | 281 | 292 | 360 |
384 |
My interest in making this table was seeing if there were any trends involving playoff teams. The Pelicans have made it very clear that the playoffs are their goal this season, and the majority of my analysis this offseason has been geared towards figuring out if there is any evidence supporting the idea that they can make it. As of now, 5 of the top Pelican players have yet to be ranked, and before these players’ ranks are revealed, I thought it’d be good to develop an understanding of good patterns to look for. Here is what I found.
Trend 1: Having a top 10 player
Qualifiers: Miami, Oklahoma City, Los Angeles Clippers, Minnesota, Brooklyn, Chicago, and the Los Angeles Lakers
Success rate: 85.7% (or 83.3% if you exclude the Bulls)
6 of the 7 NBA teams with a top 10 player made the playoffs. The exception? The injury-riddled Timberwolves, whose best player, Kevin Love, missed almost the entire season. It is also notable that Chicago’s only top 10 player, Derrick Rose, missed the entire season.
Trend 2: Having 3 players in the top 50
Qualifiers: San Antonio, New York, Oklahoma City, Memphis, Miami, Boston, Chicago, and the Los Angeles Lakers
Success rate: 100%
Each of these teams made the playoffs.
Memphis traded one of its top 50 players, Rudy Gay, roughly halfway through the season. Take that for what you will.
Trend 3: Having 4 players in the top 100
Qualifiers: San Antonio, Memphis, Oklahoma City, Miami, Indiana, Denver, Dallas, Chicago, Brooklyn, and Boston
Success rate: 90%
The only qualifier in this category that didn’t make the playoffs was Dallas, whose best player, Dirk Nowitzki, missed 29 games (noticing a trend here?) and was working himself back into form much of the season. Dallas missed the playoffs by 4 games.
Visual Aid
It is a lot easier to see the trends with some visual aid, and here is the picture that I used to help me out. The numbers are a little harder to see here than they are in the table above, but the colors are easy to pick out.
Color keys:
Green: Players 1-10
Blue: Players 11-50
Yellow: Players 51-100
Conclusion
These trends are not meant to give exact percentages of what to expect with NBA rank. Rankings are subjective and the NBA is a fluid league, and I’m not trying to say that any of these trends are an absolute, end-all-be-all indicator of who is making the playoffs and who isn’t. There are plenty of factors in play, such as coaching, chemistry, health, etc. Ranking the top 500 players is anything but an exact science, and the parameters that I defined (top 10, 50, 100) are, well, arbitrary. But these patterns were very clear from the data and are at least another set of lenses with which we can view this upcoming season.
I realize that the correlation of teams with better players (in this case, higher-ranked) and success is obvious. But the NBA is a star-driven league, and role players tend to be somewhat interchangeable. This is why I was more concerned with the organization of the top players from each team than, for instance, the team with the lowest sum from its top 12 players’ ranks. If anything, this is just a fun look at an exercise that generates a lot of interest from fan bases across the nation.
9 responses to “NBA Rank and the Pelicans”
While we may not YET have a top 10 player (AD will be soon), we easily have three top 50 players (AD, Holiday, Evans) and at least four if not five in the top 100 (Gordon, Anderson). The fact that all of these players are relatively young bodes well for our future – both this season and for seasons to come.
nmasri I’m not sure how Evans will be ranked, but I’d be surprised to see him in the top 50 right now. In terms of talent, Gordon is easily top 50, but he just hasn’t shown that he can stay healthy. Ryno deserves to be top 50 every year
I agree that Davis will be top 10 sometime in the next couple years, and I wouldn’t be surprised to see Jrue as a top 30 player within a couple of years as well.
Whatever it winds up being, we have a lot of talent, and all of it is very young. Exciting stuff
Pelicans would fall under trend 3. They’ll surely have 5 players in the top 107.
I love this article and you can see that Talent will lead to success. The question is will we have 6 people in the top 100 in two years.
adfly highly likely that we will have 5 top 100 players. It’s exciting
SamuelWhoDatWilcher I’m not sure that we’ll have 6 in the top 100, but I feel pretty sure we’ll have a top 10 and 2 others in the top 50. Talent is surely there
Very excited about the top 100 talent that’ll be on full display I’m New Orleans
16 teams have 2 players ranked in the top 50. 14 of those teams made the playoffs. The only 2 teams that missed were the Twolves (Klove hurt) and the Hornets (Gordon hurt). Pretty remarkable considering that there are only 16 slots total. 7 for 7 in the east and 7 for 9 in the west.
mazonmafia good eye! I’m doing a second article on this sometime in the near future and will be sure to add your trend.