When Elfrid Payton was first signed, there was a lot of hullabaloo about his fit. As the dust settled, it became clear the idea was to put him in an up-tempo system that allowed him to play in the open floor. This message was reiterated by Dell Demps at the press conference introducing Payton and new teammate, Julius Randle.
“We met with Elfrid, and he was our first meeting… We’ve been studying him over a long time and we really feel like his skill set is going to make us a better team…Our coaching staff did a great job of showing him some video and some analytics that showed with the way he plays, that he’s gonna elevate our group.”
The emphasis on “analytics” is mine. Throughout the press conference, all parties repeated the desire to push the ball in transition. And why wouldn’t they? We all saw the success the team had post-Boogie by ramping up the pace and fully committing to running. Now these newly signed players are expected go all in on this philosophy as well. Naturally, when Dell mentioned he really liked what the analytics said about Payton’s fit, I was curious to see the numbers myself.
Payton’s Numbers and Defining Early Shots
We the public do not have access to nearly the same volume or power of tools that team analytic departments do. However, with the help of a few scripts (shoutout Patrick), excel, and the data available on stats.nba.com, we can gather reasonably workable data to evaluate trends. I wanted to see what exactly it was that made Payton such a good fit. Since the front office is emphasizing pace, my inclination was to turn to shot clock data and see how good Payton was in various situations. The Pelicans value early offense, and I was looking for two things – what portion of Payton’s offense came early in the clock, and how efficient he was. Since the data is divided into various ranges in the clock, it was important for me to define “Early Shots”. Please take a look at the chart below. Feel free to open the images in new tabs to see the full-sized versions. Seriously, I recommend it.
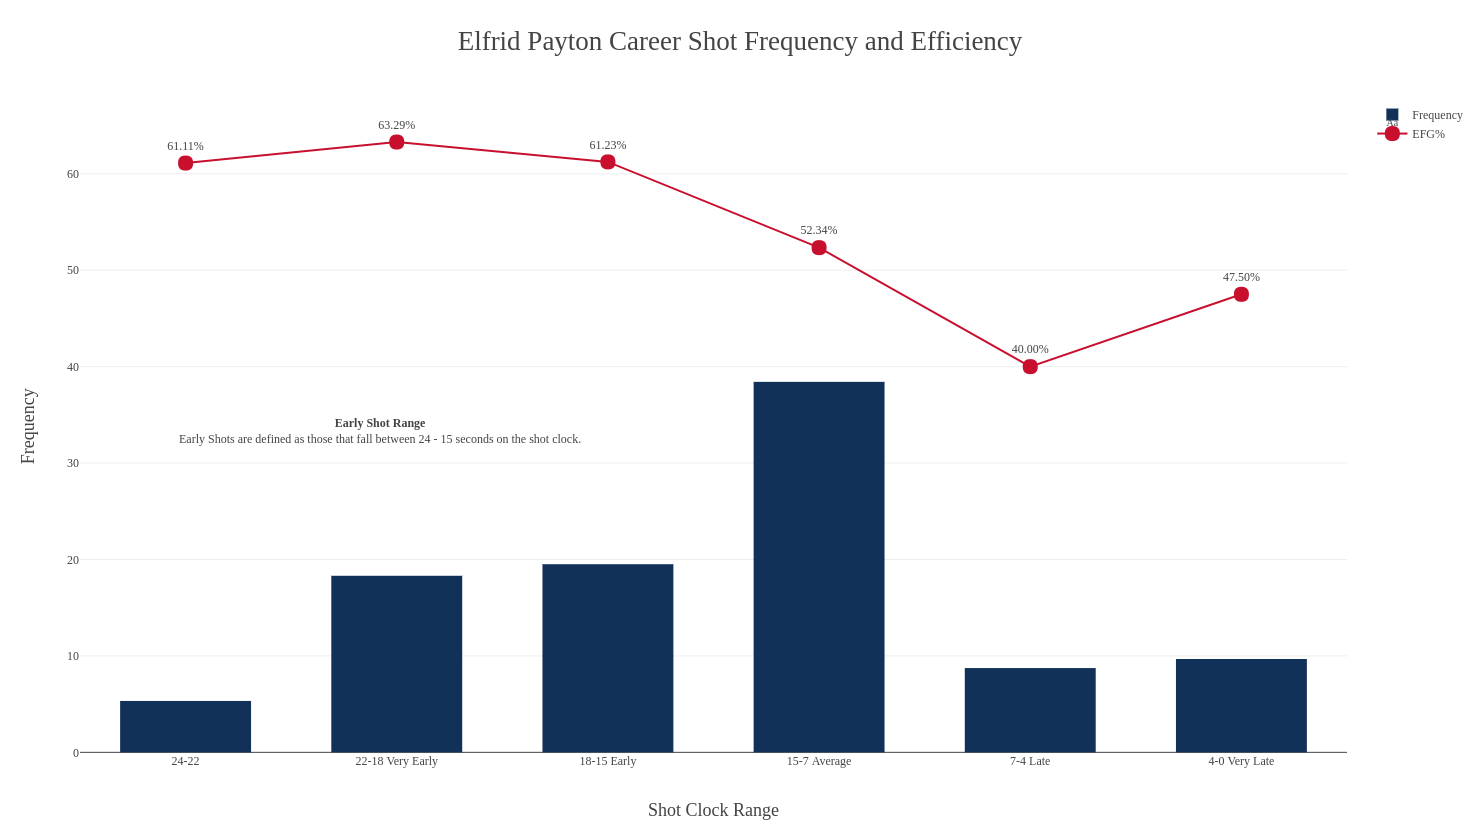
The data above is how Payton has performed for his whole career. The bars represent the percentage of offense derived from each portion of the clock. The red points represent his efficiency measured in EFG% at each portion of the clock. As we can see, the bulk of Payton’s offense has come from the “Average” range. Yet we can see clearly that Payton is at his most efficient in the early portions of the shot clock, or what I like to call the “Early Shot Range” (24-15 seconds). As the clock winds down, Payton’s efficiency drops precipitously. Payton being solid in the Early Shot Range bodes well for a team that saw nearly 50% of it’s offense come in this time frame. To maximize Payton, the Pelicans will need to increase the volume of shots he sees earlier in the clock and decrease the volume in the Average and Late ranges. In fact, when you look at what percentage of his shots fall in the Early Shot Range across his career, you’ll notice a promising trend.
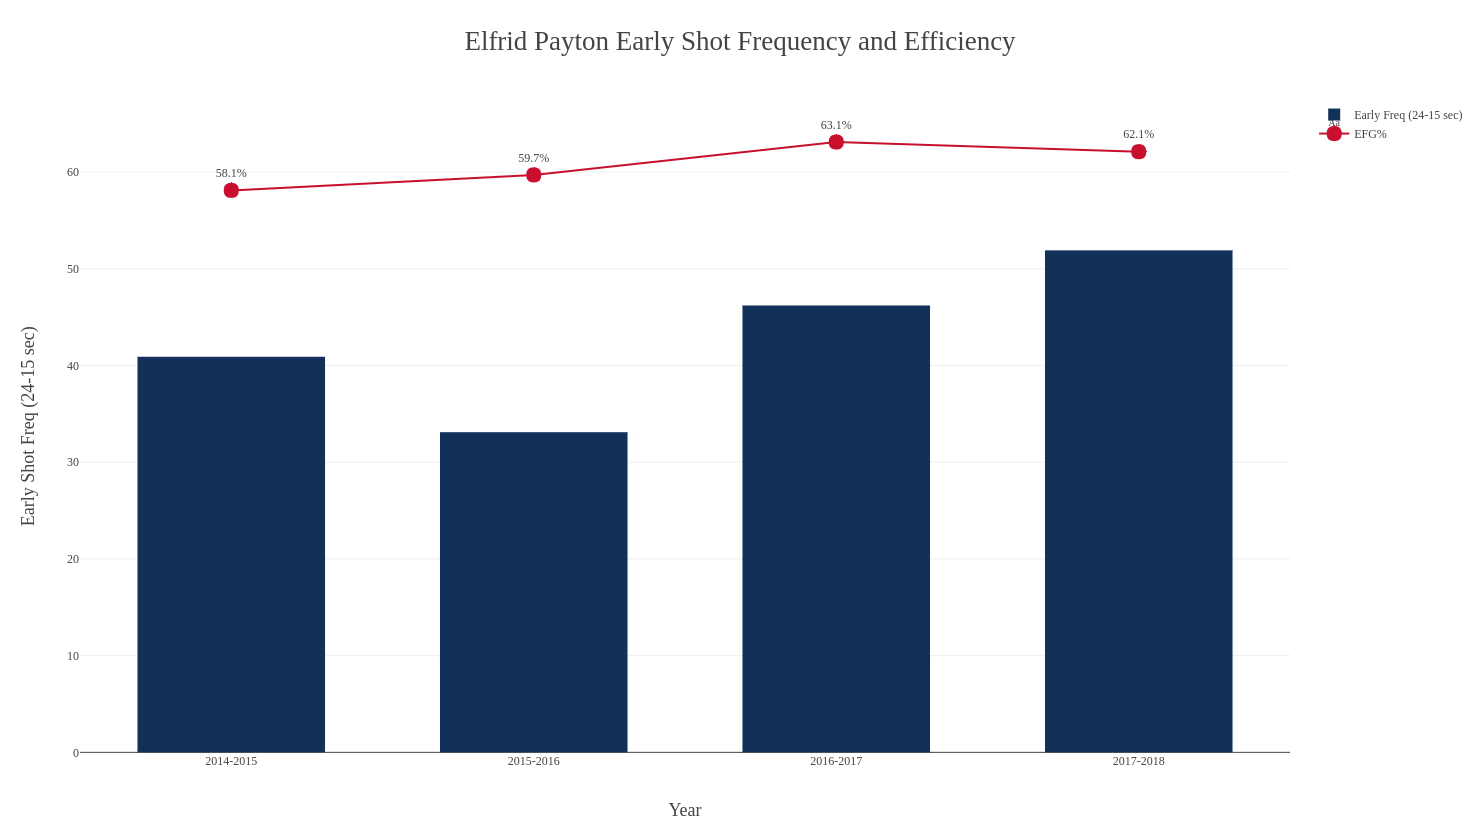
Not only has Payton steadily been taking more Early Shots, he has gotten noticeably more efficient. Payton took 51.9% of his shots in the Early Range in 2018, sporting a EFG% of 62.1%. It should be no surprise that 2018 was also Payton’s most efficient year in the association. The Pelicans should look to replicate this shot distribution, perhaps even augment it. Payton’s numbers from Early Shots were so high, I had to pit them against the rest of the league. This led to an unexpected discovery.
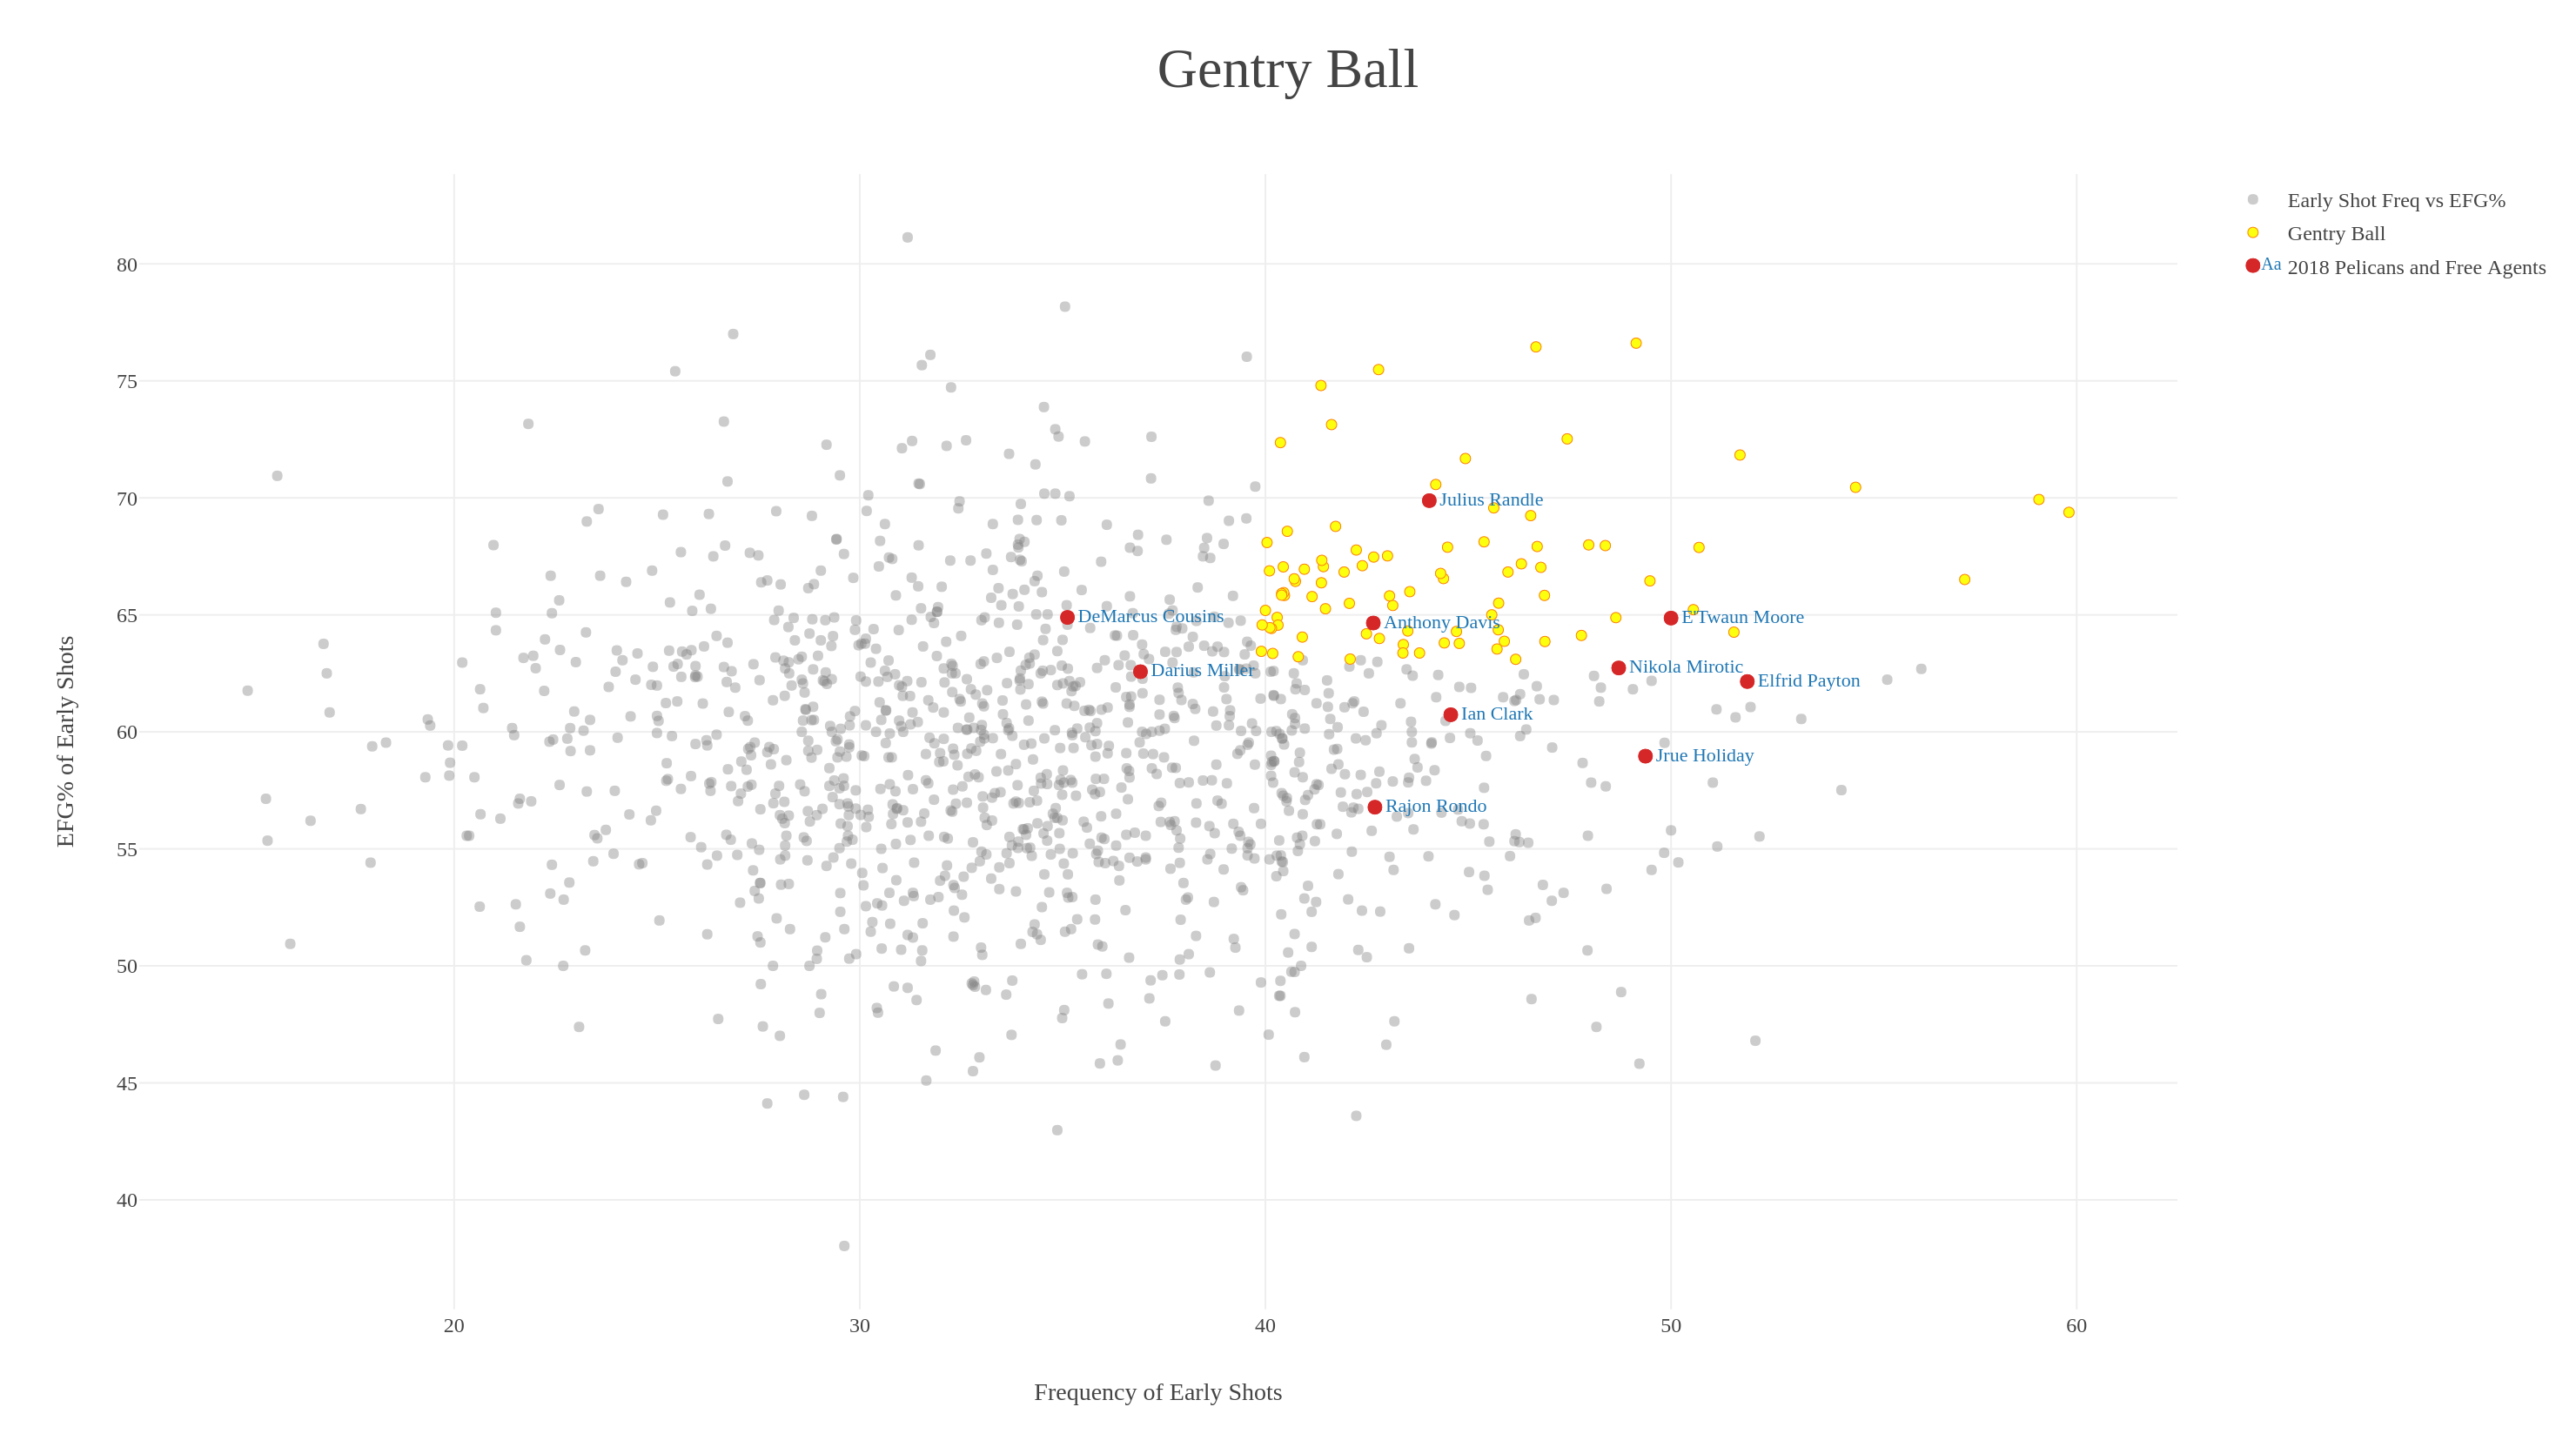
Introducing Gentry Ball
We’ve all heard of “Morey Ball”. The Houston GM is a living legend in analytic communities and is perhaps best known in this realm for his aversion to mid-range shots. Year after year we see the Rockets break new records for 3 point attempts. The idea behind this is that the expected value from mid-range shots is lower than those taken from beyond the arc (or at the rim). If you want to brush up on this concept, you can read my Intro to Shot Selection piece here.
Gentry Ball takes its inspiration from Morey Ball but uses a different form of shot distribution to evaluate players. While Morey Ball is concerned with the where, Gentry Ball is concerned with the when. I thought that Payton had remarkably high numbers in both the frequency of Early Shots (24-15 seconds) and efficiency – hallmarks of what I would consider a true Gentry Ball player. The only way to find out was to compare his numbers against the rest of the the league. I was able to gather data from 2013-2014 onward on the frequency of Early Shots and how efficient each player was. Low volume players were filtered out. Here is the result of over 1200 player instances and how the seasons of the 2018 Pelicans and their new additions compare.
Processing The Data
Okay so there is a lot to take in here. First, this data includes individual player seasons from 2013-14 to now. This means that 2016-2017 Anthony Davis is a data point in this chart along with 2015-2016 Davis as well (along with all the other players hence the 1200+ instances). The golden zone represents the true Gentry Ballers. These are are players who have put together seasons that are in the upper quartiles of BOTH frequency and efficiency. The red points represent how the Pelicans from last season, along with Randle and Payton, stacked up.
Right off the bat we can see Davis, Moore. and Randle squarely in the golden zone with Clark, Mirotic, Holiday, and Payton right on the cusp. From a frequency standpoint, the guys on the cusp are more than qualified, they just need slight bumps in efficiency. But let’s take a second to talk about Randle. I was extremely surprised to see him near the top right corner. I had expected Davis to be near the the top when it came to efficiency, but to see Randle top him in both efficiency and frequency is astounding. Just over 44% of Randle’s offense came in the Early Range, and he notched a blistering 69.9% EFG%. This lands him in the 90th percentile for frequency and 96th percentile for efficiency out of over 1200 instances. What’s more is the stark difference between his production early in the clock and Cousins’s. I can’t wait to see Randle in action in this offense with Davis running next to him.
It’s easy to see from this data that the Pelicans have accumulated a series of players who are good at running. Payton is far better at this tempo stuff than I anticipated. While there is more to basketball than just getting out and running, it’s encouraging that the Pelicans’s current collection of players are close to forming a tight knit cluster in the golden Gentry Ball Zone. The Pelicans obviously did their homework and the math checks out.
4 responses to “Introducing “Gentry Ball”: A Look Into Early Offense and The Fit of Elfrid Payton”
The general EP narrative around the NBA has been dead wrong IMHO. It is great to read someone who actually did their homework! I watch at least 80 Magic games/season and they have zero player development, zero discipline, zero accountability. The last 2 seasons they have focused on making Aaron Gordon into their super star while neglecting his development and the development of any other of the young guys on the team.
EP can fly down the court with the ball always looking for the open man. He is not a high volume shooter, only about 2 3-point shots per game but last season he averaged about 37.5%. His ability to get to the rim and his willingness to kick out offsets his lack of 3-point volume.
If you watch highlights from his rookie season he defended baseline to baseline and was a nightmare for opposing point guards. His weakness on defense is that he likes to play for steals and rebounds instead of playing tight defense on his man. With good coaching this should be easily correctable.
I think EP and the Pelicans were made for each other and I have to figure out a way to watch their games without giving my wife a coronary. Good luck to you both in the upcoming season.
Can you identify for us the best of the golden Gentry Ball players that are not pels? Any of those flying under the radar as trade targets of free agent acquisitions?
Also interested in seeing which small forwards are in that golden zone or higher.
[…] An analysis of “Gentry Ball” by Kumar also revealed some promising trends surrounding Payton’s game. As he points out: “The bulk of Payton’s offense has come from the “Average” range. Yet we can see clearly that Payton is at his most efficient in the early portions of the shot clock, or what I like to call the “Early Shot Range” (24-15 seconds).” […]