Here is a scouting report for Anthony Davis from NbaDraft.net before the 2012 draft:
Offensive canvas is raw, with obvious enormous room for improvement … Doesn’t yet have a feel for his jump shot, often rushing the attempt and shooting a flat shot.
The rest of their breakdown of AD’s weakness followed the same format. Basically, the story was that AD had incredible potential, but he was still a raw prospect offensively. Outside of questions about his strength, this seemed to be the biggest concern about Davis. That is, could his offensive production ever match his defensive prowess?
Davis has gone through two NBA off seasons. He has also spent time on team USA. Considering his incredible offensive production so far this season, it seems like this would be a good time to go back and check up on these concerns. How has the scouting report changed since his rookie year? Where has he improved? Where does he still need to improve? Let’s try to answer these questions by looking at some shot data.
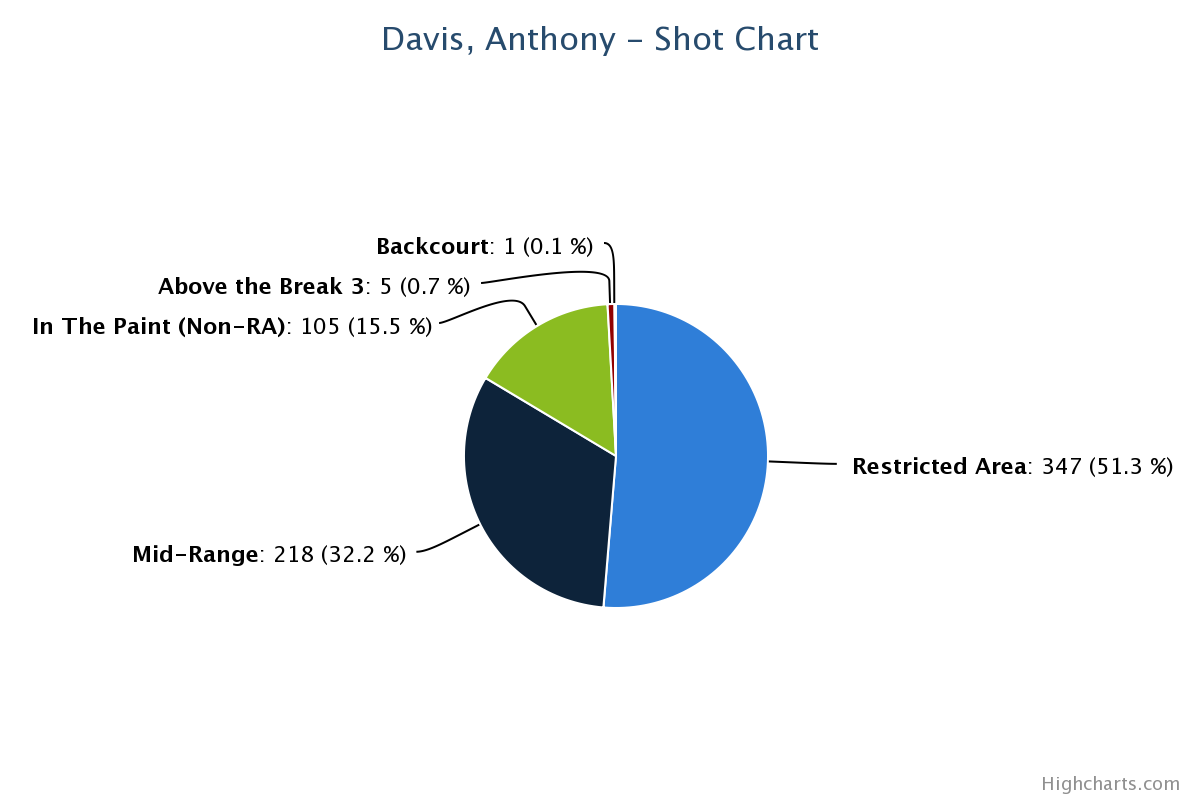
This pie chart breaks down where Davis took shots from during his rookie year (2012-13 NBA season). It was made using NBAsavant.com. If your a fan of basketball, numbers, or pretty charts, you should click the link and play around with it. What does this information tell us? As a rookie, Davis took 676 total shots. Most of those came from inside the restricted area. That’s good. We all know that the restricted area is one of the best places to get good shots. It is a high efficiency zone. On those shots, Davis shot 68.3%. That’s good for a big man, but it isn’t spectacular. Another 15.5% of his shots came from inside the paint, but outside the restricted area. On those shots, his field goal percentage was 45.7%. You’d really like that to be higher. I’m not arguing that it is embarrassingly low, but we tend to grade AD on an all-time curve.
That’s all fine and good, but the real area of interest for me is the mid-range. When critiquing his offense, this is where scouting reports focused. The story was that his jump shot had potential, but it wasn’t there yet. According to NBAsavant, which uses player tracking data from the NBA, Davis shot 29.4% on his mid-range jump shots. Note that different websites define the mid-range in different ways. From what I can tell, this is pretty much everything outside the paint. Also, this is the NBA’s data, so there shouldn’t be questions of data quality. Though, it may be fair to raise questions about how the data is defined.
Long story short, AD was a very bad mid-range shooter his rookie year, despite taking almost a third of his shots from that range. So what happened the next year?

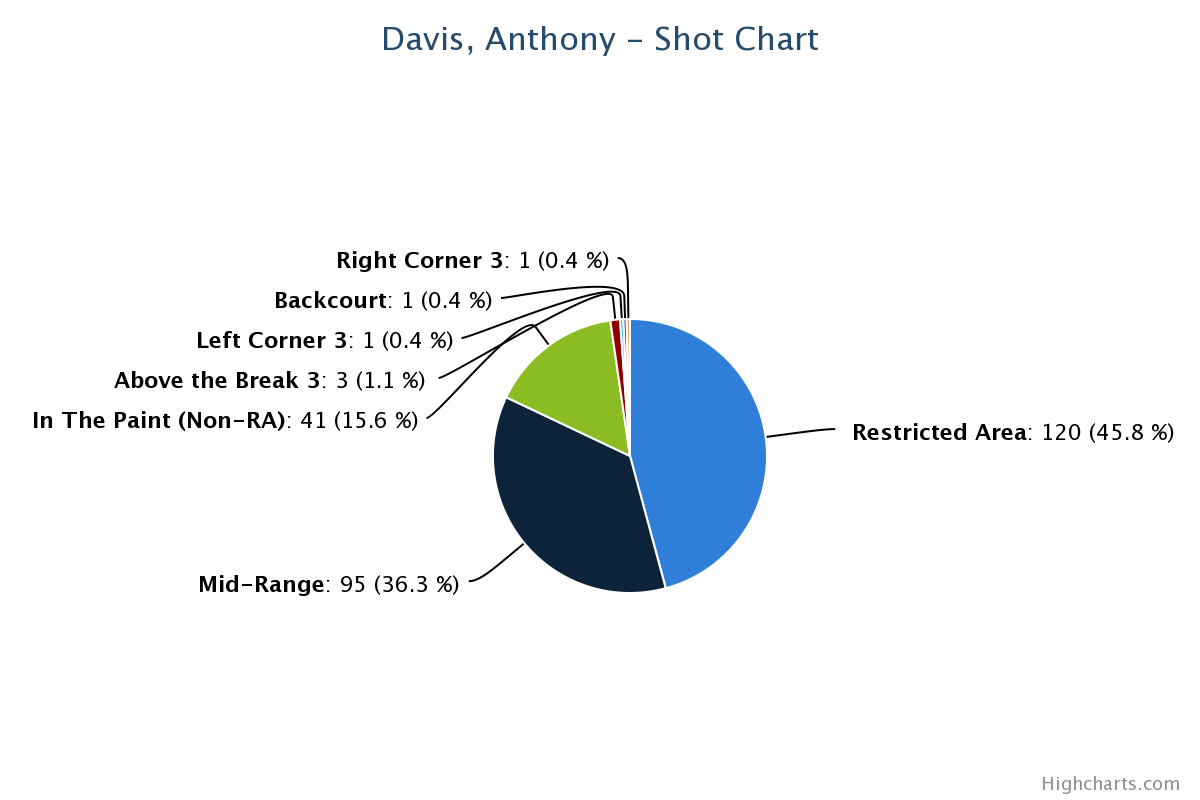
This is the same chart for Davis’ sophomore campaign (2013-14 NBA season). First of all, Davis took a lot more shots (1,005 compared to 676). This could be an indication of a couple of things. It could mean that he got better as an offensive player. It could mean that Monty trusted him more and ran more plays for him. It could even mean that he demanded the ball from his teammates more. In fact, these aren’t mutually exclusive. All of them could be true. Besides all of that, Davis just played a lot more in his second season (512 more minutes), so some of that accounts for the increase. Right now what matters to me, is how his shot distribution and field goal percentages changed.
First, we see that he took a smaller proportion of shots from the restricted area. That’s just a number. Davis could have stepped away from the basket by choice, or he could have been pushed out by defenses, who adjusted to the scouting report. Next, it is clear that he is taking more shots from the mid-range and non-restricted area of the paint. Again, the overall point is that he drifted away from the basket. Before we judge if this is a good or bad thing, let’s look at how his field goal percentages from those ranges changed from his first season to his second.
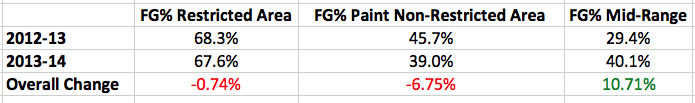
He shot a little bit worse from the restricted area, but the change was so minor that it could be negligible. His decrease from the paint non-restricted area is so sharp that it probably is significant. However, we don’t have any indication that something about AD’s game changed. It could have been that with all the injuries last season defenses were able to key in on him entirely. That increase from the mid-range, however, is change we can all believe in. That’s an insane increase. This was the main scouting report concern before the draft and guess what? He got much much better. That’s the major take away for me. His weakness has become a relative strength. We are still in the small sample size zone for this season, but let’s look at where his shots are coming from this year.
This season looks a lot like last season for Anthony. More of his shots are coming from the mid-range, and a few more of his shots are coming from the restricted area. It is only a minor increase, and it remains to be seen if that continues for the rest of the year. If it does continue, then we could be looking at Davis and Monty finding his most optimal shot distribution. That is, taking most of his shots inside, but also pressuring the defense by stepping out and hitting from the mid-range.
I don’t want to go into this too much, because it deserves it’s own post. However, let me make a quick point. Great defenses take away shots at the rim and shots from behind the arc. That’s where good offenses are most efficient, and, by definition, great defenses make good offenses less effective. Great offenses counter great defense by taking mid-range shots, when they are the best available shot. Those offenses are successful, when they hit those shots. To quote Jason Calmes from our most recent podcast, “You’re going to have to take mid-range jumpers, so you might as well have somebody who can hit them.”
But I digress. AD is actually shooting better from the mid-range, as well. He is hitting about 42.1% of those shots. For a comparison, LaMarcus Aldridge is shooting 40.6% from mid-range this season. Davis is also better from the restricted area and non-restricted paint area, shooting 72.5% and 46.3% respectively. Let me tell you what you already know, he has got a lot better all around.
One last comment before I close this out. A lot of fans want to see Davis become a 3 point threat. That’s fine, and I think it is possible. However, I’m not sure he will ever shoot enough 3’s to appease those fans. You definitely don’t want him standing in the corner all the time on offense away from the action, and considering his wide-range of offensive skills it might make more sense for the Pelicans to use him where the team is relatively weak. That probably means scoring from the mid-range using jump shots, while also scoring inside from the post, off pick-and-rolls, and drives to the basket. Long story short, Davis will eventually be the type of player who doesn’t have a real weakness. It may always be in our best interest to use him in a way that covers up for team weaknesses. I’m not saying this is the answer or absolutely correct, but I am suggesting it is something to consider.
What does this all mean? Anthony Davis came into the league at 19 years old. Like all 19 year old basketball players, he had some obvious weakness and deficiencies. Unlike almost all 19 year olds, he had some raw qualities that made his potential seemingly unbounded. The key for the Pelicans was making sure he improved and took advantage of that potential. So far, he has. That’s the story here. We are watching a player achieve his potential, especially on offense, in a historic way. It is easy to gripe about a lot of things as a fan, but let’s enjoy that fact that we are watching a superstar realize his potential. It doesn’t happen all that often.
One response to “The Progression of Anthony Davis’ Offense”
[…] Read it here: http://www.bourbonstreetshots.com/2014/12/01/the-progression-of-anthony-davis-offense/ […]