This is a new series called Show me the Data. I’m hoping to publish a data heavy, analytical, or academically focused piece on the Pelicans or an NBA topic every other week. My goal is to provide something more analytical and less opinion based. If you have any questions, comments, or data you’d like to see examined, tell me on twitter @nicklewellen.
Anthony Davis is one of a kind. He is rare both in terms of his physique and skill set. That makes finding a comparable player pretty much impossible, which makes predicting his development even more difficult. The only player that really comes close to matching Davis is Kevin Garnett. They both entered the league at 19 years old, and they have similar body types. Still, this comparison is pretty weak. Garnett went straight from high school to the NBA, which may have stunted his performance in his rookie year. Additionally, Garnett came into the league at a different time. In the mid-90s, his lack of size pushed him to play outside more in his first two seasons. However, the whole league has drifted to a smaller faster game, and Davis has played PF and C for most of his first two seasons.
Davis’ unique game, youth, and excellent play got me thinking about a few things. First, how does Davis at this age compare to other great big men in the recent era (last 20 years or so)? Second, how long did it take on average for those great big men to develop? Meaning, when can we expect Davis to reach his peak. Finally, can looking at his peer group tell us anything about his ceiling as a player? The only way to answer these types of questions is to dive right into the data. Here we go.
The Data Set
I wrote a piece about this time last year called Projecting the Development of Austin Rivers. One of the issues I addressed in that piece was sample size. Sample size is something that self-proclaimed stat geeks freak out about, and they should. However, it isn’t an end all be all. The quality of data can often be more important that the size. Sure, we may need a lot more observations for complex statistical measures, but we aren’t going to get a good understanding of Anthony Davis’ development if we just look at all the point guards in the 1970s.
So to answer the questions I listed above I complied a list of the guys I consider to be the best big men and, in some cases, the most like Davis since the late 80s. I resisted going back any further; because I felt the NBA’s metagame had just changed too much for it to be incredibly relevant. Also, the more recently the player played the more liberal I was in their inclusion. My logic was that those players faced a league and metagame more similar to Davis, so while they might seem like they aren’t as accomplished as other players on the list, they played under similar conditions.
I also want to make a couple of quick comments about the variables I’m going to use, before we get any further. If we wanted to make things complicated we could use a lot of variables to measure player production. We could just use traditional stats like points, rebounds, assist, or steals, or we could use a litany of advanced stats. I’m opting to keep things simple. For this article, I’m just going to use Win Shares per 48 minutes (WS/48). I prefer a few other composite metrics, but frankly, there are difficult to find outside a few academic resources and often they are only available for current players. Some other more involved data analysis I have done did show that using something like WS/48 does round the edges a bit, but it also keeps your model from going crazy. In short, WS/48 is effective and hard to screw up for data analysis.
|
Table 1. Players in the Data Set |
||
| Name | Age as a Rookie (WS/48) | Age at Peak WS/48 |
| Alonzo Mourning |
22 (.148) |
29 (.148) |
| David Robinson |
24 (.241) |
28 (.296) |
| Tim Duncan |
21 (.192) |
25 (.257) |
| Shaquille O’Neal |
20 (.163) |
27 (.283) |
| Hakeem Olajuwon |
22 (.168) |
30 (.234) |
| Yao Ming |
22 (.176) |
26 (.220) |
| Patrick Ewing |
23 (.084) |
31 (.211) |
| Karl Malone |
22 (.036) |
33 (.268) |
| Dirk Nowitzki |
20 (.040) |
28 (.278) |
| Kevin Garnett |
19 (.092) |
27 (.272) |
| Pau Gasol |
21 (.121) |
30 (.232) |
| Anthony Davis |
19 (.159) |
|
I don’t want to defend my choices of players to include more than I already have, but I will say that these are the guys who repeatedly showed up when I searched for players comparable to Davis. At any rate, a quick look at the players in our data set shows that the late 20’s and early 30’s are when players peak. Of course, we are going to dive in to those numbers a bit more in depth later. The next obvious thing is that despite his age, Davis had a particularly productive rookie season. Ewing, Malone, Nowitzki, and Garnett were all below average players their rookie years (purely average would be set at .100).
Just looking at the data set gives us a vague answer to a couple of our questions, but we can do better. If we average this group’s WS/48 at each age, we can produce a nice function that may tell us what effect each additional year has on a player’s production. Obviously, Davis will not be included.
The Results
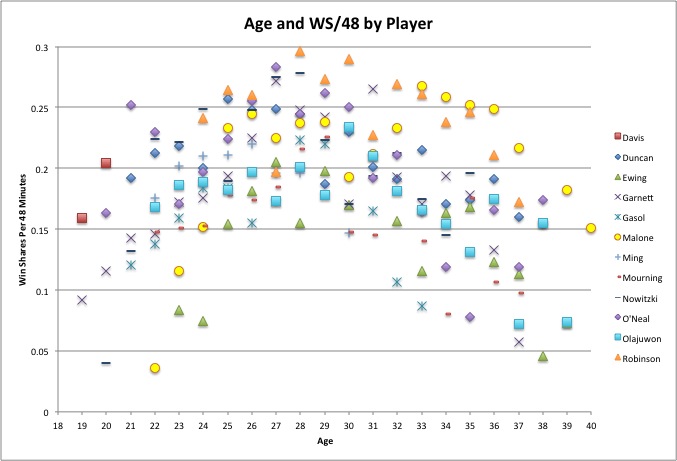
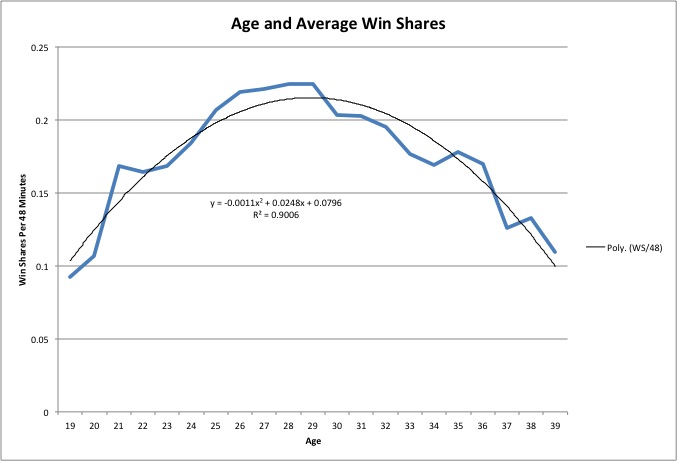
Graph 1 shows a basic scatter plot with player ages on the horizontal axis and WS/48 minutes on the vertical axis. The two red boxes over 19 and 20 are Anthony Davis’ data points. Everyone is labeled with a different mark, which maybe difficult to read. However, I think it is interesting to see an individual player as a part of a greater trend. At any rate, we can see from a simple eye ball test that there are a few outliers, but it is also pretty clear that there is some type of trend line that increases, to a point, as a player ages. The next graph I will show also graphs WS/48 and age, however it includes a trend line through the scatter plot. The final graph and the one I’m going to focus on is a line of the average win shares at each age for the data set.
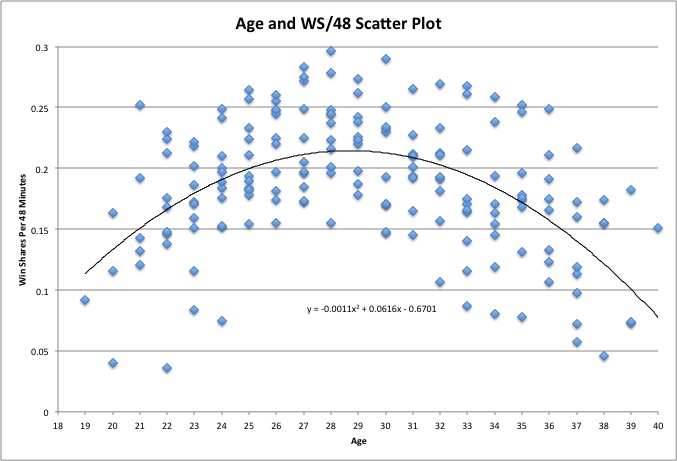
First, a couple of notes about Graph 2, I removed Karl Malone’s final season from the data set, because they were the only player playing at 40. Frankly, it had very little effect on the model, but I felt he was still an outlier. Again, player production is being treated as a function of age. The blue line is our data line, and it looks about like what we would expect. The extreme rises are usually due to a player having a break out year (i.e. outliers), and the dips can be that one player was injured or began to decrease suddenly (ex. Ming). The black line is our polynomial trend line. I’ll talk more about that soon.
Before you comment that player production as a function of age is overly simplistic, recognize that age does not just account for an extra year on earth. Age basically is serving as a proxy variable for NBA experience, physical growth or damage, and an extra year of training. In other words, age is a very nice variable in sports analytics, because it picks up and is correlated with a bunch of other stuff.
Now, let’s actually talk about the results and graphs. First off, our blue line looks about like we would expect it too. Guys start off a bit below the average for an NBA player, but there are sudden increases during their first couple of years. Eventually, those leaps taper off until player’s breakthrough in their late 20s to early 30s. This seems to be the optimal time for players physically and mentally. These peaks probably have little to do with a single variable, but are the product of several things hitting at the right time. By a player’s mid 30s, things start to decrease. The data got a bit choppy here, because frankly, the data set was thinning out due to retirement and injuries. I suppose you could treat that as a shortcoming of the data, but I don’t think it would get a lot better if the sample size grew to a huge number. The end of players career’s are odd and difficult to predict. Some guy’s play forever, and other guys suffer a string of freak injuries.
The most exciting thing about these results to me is our trend line. Basically, a trend line takes your data and estimates what the equation for a perfect line would before your data. Of course, our line doesn’t match up with data perfectly, but that is basically impossible. There is actually a measure used to estimate the quality of fit of a trend line, R2. Now, I don’t want to get into the hairy details of R2, but you should know that it ranges from 0 to 1. If it is easier you can think of this as from 0 to 100%. The higher your R2, the better your data fits. Our R2 is at .9006 or at 90%. That is a very high result. This means that there is a very strong relationship between player production and age. Obviously, we can argue about causation all day, and some of those comments would be valid. However, the reasons for why a player might improve as he gets older are pretty obvious (again, proxy variable). That is to say, that causation can probably be justified by common sense and logic.
The equation for our trend line can actually tell us even more about our data. I copied it below.
y = -0.0011x2 + 0.0248x + 0.0796
WS/48 and age have been replaced by Y and X respectively. The final number is the intercept, but we don’t really need to worry about it. You may notice that there are actually two X variables in our equation, X and X2. This is something that is unique to variables like age. You see age isn’t a linear function when it comes to production. In other words, you don’t just get better and better at basketball the older you get. Eventually, your body begins to break down and become less effective as you face the sad reality of aging. This means that there are diminishing returns of aging for production.
Think about it this way. From the age of 19 to 20, you’d expect to see a huge boost, but from the age of 36 to 37 you wouldn’t expect much. In fact, you’d probably expect to go down a bit. That is what the little number or coefficient before X2 is showing us. The coefficient for our X’s show the effect that each additional year of aging has on a player’s WS/48. Again, this is just an estimation, albeit a good one. The coefficient for X2 is negative, which is what we would expect to see, since aging is beneficial only up to a point.
What does it mean for Anthony?
Before I go back and answer our original questions, I want to make a couple of AD related points. First, Anthony was unusually good as a 19 year old. He didn’t play a lot, but he was effective when he did. Was he perfect? Not at all. Did he dominate? Not very often, but not many rookies do. He was efficient, and that is incredibly rare. Let me put it this way. At 19, Davis was playing like the average 21 or 22 year old in our data set. Think about that and think about the guys in our data set. Oh and this season, Davis has played like a 26 year old in our data. That means he is young and unbelievably skilled even when compared to the most elite players in modern history. I expect you just peed a little from excitement. That is totally justified and understandable.
Well, we already answered how he compared to these elite players, but it is a bit more difficult to know when he will peak. Part of me thinks he will peak a bit on the younger side of things, because he came in to the league so young. However, he is developing a nice and diverse skill set so quickly that I could see him beginning to peak very early but sustaining it for a bit longer than average. The truth is there is know way of knowing. A lot of chance and uncontrollable variables dictate when a player peaks. Obviously, a big part of it is the coaching staff and players around him. There is no way to really absolutely control when a player peaks, but you want your team and staff to be ready when he does. That is the time for championships.
But what about the million dollar question? How high is Anthony Davis’ ceiling? That is a difficult question, but let me use our data to give a couple of possible answers. First, I know he isn’t physically similar to this guy, but I think Davis has a shot to produce like David Robinson did. They both had similar stat lines, despite not having similar physiques. The scary part is Robinson was a rookie at 24 due to his Naval obligations. Where will Davis be in 4 seasons?
Michael McNamara and I talked about Davis’ ceiling one time on twitter. I admitted that I’d basically given up trying to put a limit on his potential. He is just too good and too different. This article and data does allow me to say that I think it is very plausible for Davis to out play every single name on this list. That’s right. I think the data clearly shows that with the right development he can be the not just the next great big man, but the best player of his generation. I can honestly say that I don’t see a ceiling for Davis. He is that special.
8 responses to “The Development of Anthony Davis”
That is a fantastic article!
NOEngineer It is. He did a bang up job of research and presentation. Look for an offshoot tomorrow and more like it.
Thank you! I also meant to leave a comment in the article thanking Jason for his comments and corrections. He deserves a lot of credit.
I think the readers will agree that you deserve more for putting up with me.
GREAT article. Really enjoyed this.
First paragraph says Garnett went straight from high school to college…?!
In an interesting side note – this graph is different for smaller players. Guards tend to reach their peak at age 24-25 and decline from there. Looks like this set of bigs reached their peak at 28.
I had heard bigs take longer to reach their best – this is a little bit of proof of that.
At least the great ones do…
The guard point is why the current bevy in the backcourt is less important than getting a youngish big soon.