
With the NBA regular season opener only about a week away, time is running thin to make projections in regards to how the Pelicans will fare this year. In other words, it’s time for yours truly to make predictions that will almost certainly end up being wrong at season’s end. In many instances – such as this one – the most difficult part of creating a projection model for a variable such as future team performance is determining what the inputs will be. Last season, if you recall, I used a form of MPG-weighted PER to assess whether or not I believed that the Hornets would be a playoff team. Looking back, the results were decent in some areas and way off in others. While events such as the James Harden trade to Houston could not have been foreseen, elements such as Stephen Curry’s jump in both performance and health sustainability along with the inability of Minnesota’s key players to stay on the court were factors that threw my expectations for a loop.
The Model – Total Team Win Shares vs. Expected Wins
In this column, I aim only to project one team’s record – our own Pelicans. While my goal was to used some advanced, all-encompassing statistical measures to do so, I decided to use win shares instead of PER to make my estimation. By nature of the way that win shares are calculated, a team’s total number of win shares will be very close to its actual win total. That being said, this win shares total will be even closer to a team’s expected win total, or “Pythagorean wins”, which factors in scoring margins to predict how many games a team “should have won” over the course of a season.
The Data
To validate my choice of inputs, I pulled the total team win shares for each NBA team over the past ten seasons from basketball-reference.com (a very tedious process) along with each team’s expected win-loss record over that same time frame from ESPN.com. I then plotted each of those points, as can be seen below:
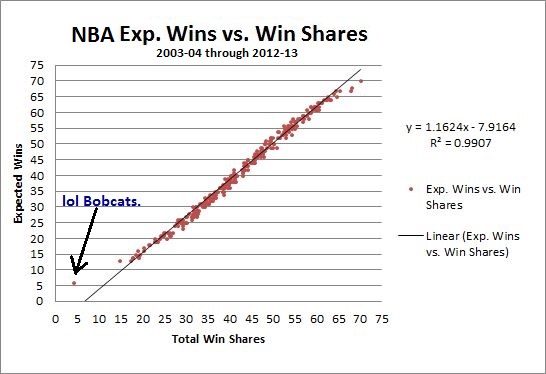
This wealth of data makes it possible to estimate a team’s expected wins based on how many total win shares it is projected to have, given by the formula in the top right corner of the chart. By entering a projection for win shares, this formula will crank out how many expected wins that team should have. The next step is projecting the win shares per 48 minutes for each Pelicans player and extrapolating that data out over the course of the entire 2013-14 season. A reliable projection will incorporate three key elements – age, health, and past performance.
The Projection
To get a full range of all possible outcomes for the Pelicans this season, I created three unique scenarios which depict the team’s ideal scenario, its worst case scenario, and then finally my expected scenario. The key components of each of the three are outlined below. (FYI – If you’d like to see the numbers behind these final projections, I have linked to a google spreadsheet at the end of the column.)
Scenario A – Injury Free
In this scenario, every rotation Pelicans player doesn’t miss a minute of action all season long, with minutes being distributed right along the lines of Michael McNamara’s rotation projection column from earlier this month. In addition to this pristine bill of health, Anthony Davis makes “the leap” and posts a WS/48 average of .19, the highest for the New Orleans franchise since Chris Paul’s 2010-11 season. All other key players improve, and Eric Gordon returns to the same level of play he reached during his last season with the Clippers. Unlikely? Sure, but no harm in dreaming!
Record under scenario A: 50-32
Scenario B – Dumpster Fire
Crash. And. Burn. Murphy’s law kicks into full force in this scenario, as injuries turn the Pelicans into a crumpled heap of what they could have been. Gordon manages just 20 games, Tyreke and Davis play only 55 games a piece, and no New Orleans player makes any noticeable progression between last season and this one.
Record under scenario B: 30-52
Scenario C – Mason’s 2013-14 Pelicans Projection
Finally, we arrive at the most logical expectation for this season. This projection allots 55 games from Gordon, 70 from Davis, and 65 from Evans. In terms of development, the young players experience modest improvements from their prior season(s), while the older players hold relatively constant in their level of play.
Record under scenario C: 42-40
So there you have it. Under “normal” circumstances, I have the Pelicans coming in just over .500. Obviously, this is one of many possible ways to project the team’s season, but one which has a relatively high chance at success provided win share estimates are fairly accurate. The main takeaway here in my personal opinion is that this Pelicans team should be able to compete for a playoff spot all season long. Whether or not they make it back to the postseason will likely be heavily correlated to two themes – overall team health and Anthony Davis’ development. If both turn into pleasant surprises, then we may be watching postseason basketball in New Orleans for the first time in three years. Here’s to hoping that’s the case.
Note: If you’re interested in my calculations, they can be found on this three tab spreadsheet.
2 responses to “The 2013-14 New Orleans Pelicans – A Statistical Projection”
Love your analysis and especially this conclusion: “chance at success provided win share estimates are fairly accurate. The main takeaway here in my personal opinion is that this Pelicans team should be able to compete for a playoff spot all season long. Whether or not they make it back to the postseason….” I completely agree that and look forward to the season, and collecting data during it to complete your last sentence.
i did something simillar and came with the same number, 43 w+- 5, really good stuff i love it! btw with the youngest team in the league and everyone lock on, it’s amazing to win 15 w more in one year, and with the crazy way our O is playing w/o tyreke could be ala warriors last year